


In the age of high-speed Internet, poor performance can spell disaster for your website. 53% of mobile site visits are abandoned if a page takes longer than three seconds to load, and 47% of consumers expect a web page to load in two seconds or less. An extra one-second delay can result in fewer page views, a loss in conversions, and an overall decrease in customer satisfaction.
Several factors affect web performance, including:
- Asset size – Large files take longer to download, increasing load times and hurting users with slow connections or limited data.
- Asset count – Before HTTP/2, assets could only be transferred sequentially over a single connection. By default, Chrome only allows six simultaneous connections per server. This led to performance tricks such as file concatenation and domain sharding, which respectively reduced the number of assets and increased the number of connections.
- Domain lookups – Each time a web page references content from another domain, the user’s browser must perform a domain lookup. This can cause more delays, especially if your website references external content or uses domain sharding.
Other factors include users’ network connections, their distance from your web servers, and the devices they use. To get a clear understanding of how your website is performing, you will need to gather data on each of these factors and its impact on performance as a whole.
Measuring performance with SolarWinds Pingdom
SolarWinds® Pingdom® service provides a suite of tools for measuring web page performance. Using Pingdom, we can track a number of statistics including page speed, uptime, and user satisfaction. We will use two of these tools to analyze performance: Page Speed, and Visitor Insights.
Page Speed
Page Speed measures the amount of time needed to download and render a webpage. Each test breaks down the page load process by request, showing the size and download time of each request. Page Speed tests can be scheduled to run at frequent intervals, and can also run from multiple different regions around the world.
For example, imagine we have a website that lets users book veterinarian appointments at clinics located all around the world. The website is called PetClinic, and it’s hosted on an Amazon EC2 instance. To make sure customers can quickly contact one of our clinics, we want to monitor the main page for performance issues. We created multiple Page Speed tests and scheduled each one from a different region:
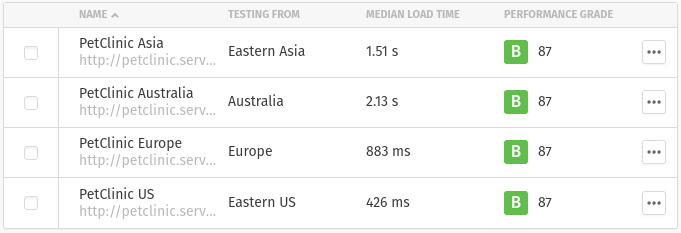
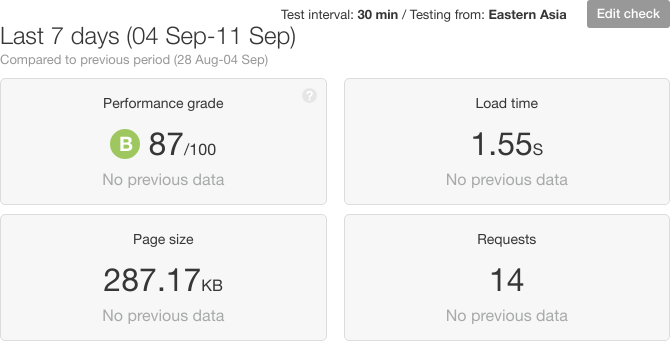
Clicking on a test opens a report from the latest run. At the top of the report is a summary showing the median load time, the total amount of data transferred, and the total number of requests made. The summary also provides an overall performance grade calculated using the YSlow test.
The report also contains a series of charts showing requests over time categorized by type and size. These help with monitoring performance over time, which is particularly important for dynamic pages or pages that have been changed. The report also contains two very useful visualization tools: filmstrips, and timelines.
The Filmstrip
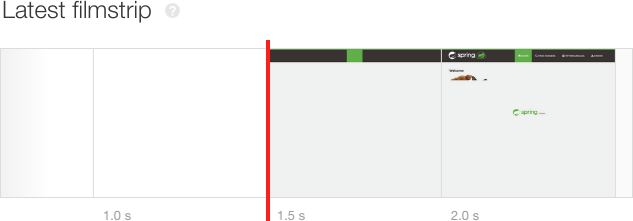
The filmstrip is a series of screenshots showing the visual changes in a web page as it loads. Rendering content quickly is important for keeping users engaged, even if only a part of the page is displayed. This is known as the critical rendering path, and it’s represented on the timeline by the first screenshot. In the following image, the HTML and CSS documents appear first, followed by images and other assets:
Understanding the timeline
The timeline is a horizontal chart showing the progress in processing each asset on the page. It provides several important metrics including:
-
- First byte received – the time when the client first receives a response from the server. Longer times could indicate server-side problems.
-
- DOM content loaded – the time when the HTML document is fully parsed. This is useful for measuring and optimizing the critical rendering path.
-
- On load – the time when the HTML document is fully parsed and rendered, including scripts and stylesheets.
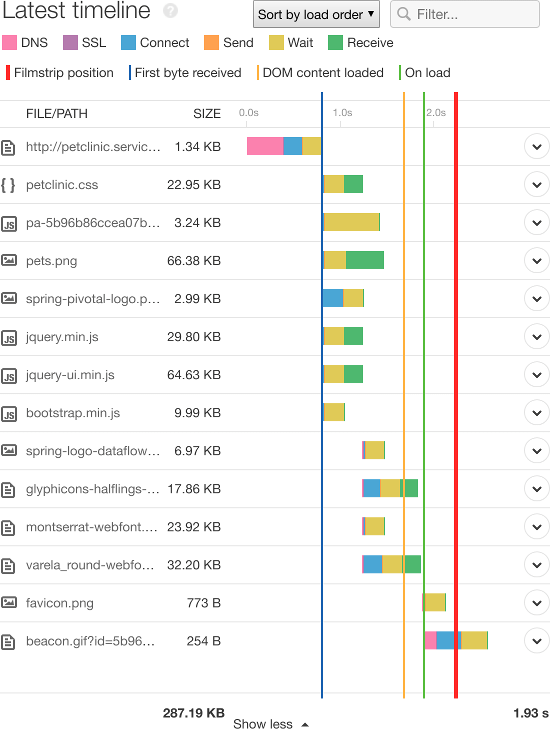
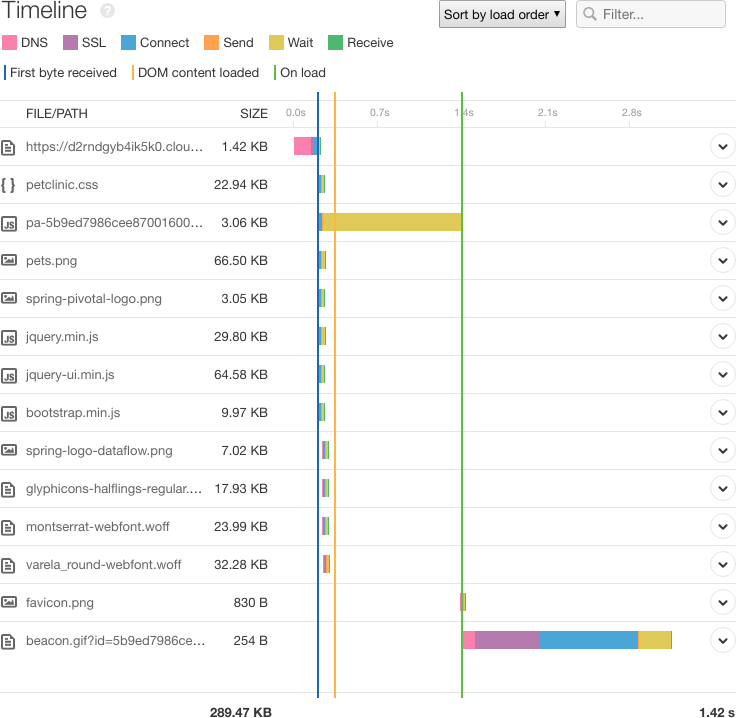
The following timeline shows where much of the time is spent when loading the PetClinic website. Since our web server only supports HTTP/1.1, we can see that much of the test’s runtime is spent waiting for assets to transfer. We are blocked waiting for the first byte to transfer. TCP connection and DNS lookup times factored heavily during the initial connection. Then, we were blocked waiting for JavaScript and image assets, which hit the maximum request limit. Using HTTP/2 to push assets immediately and loading Javascript asynchronously would have improved the page load time.
Visitor Insights (Real user monitoring)
Visitor Insights offers an in-depth view of web page performance using actual page visits. Whereas Page Speed provides performance-based statistics run in an ideal environment at a data center, Visitor Insights focuses on the user experience in the real world. It uses real user monitoring (RUM) to collect data about each user’s session, providing insight into:
- The number of users on your site
- Which pages are visited most often
- Which devices and browsers visitors use
- How satisfied visitors are with performance
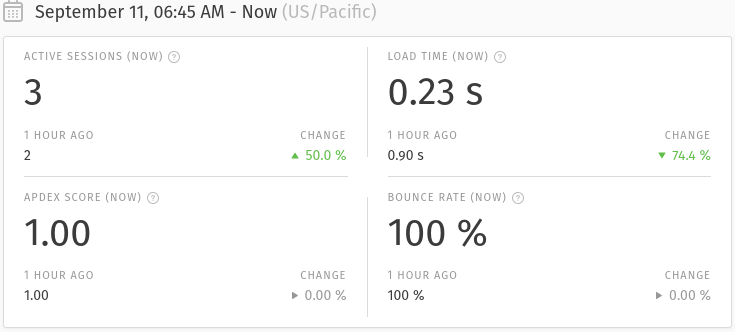
A site monitored with Visitor Insights continuously collects and reports data on user activity. Viewing details about the site displays a summary showing the number of active sessions, the average load time (the time taken to download and render the page), and the bounce rate (the rate of users who leave after a single page view). The summary also includes an Apdex score, which measures user satisfaction based on load times. A score of 1 means users are completely satisfied, while a score of 0 means users are frustrated.
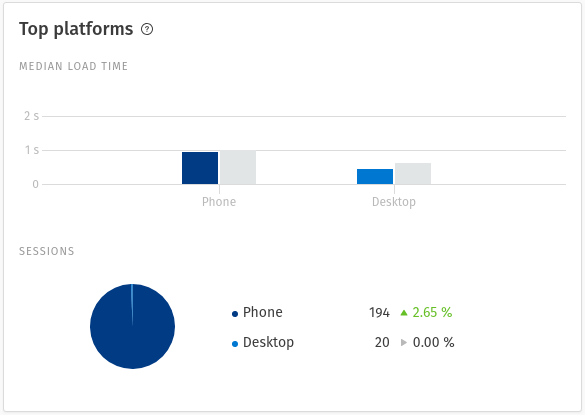
Performance can also vary based on the user’s browser, device, and location. Fortunately, Visitor Insights provides a number of charts comparing each of these data points. For example, the “Top platforms” chart compares the median load time for users by device type. If mobile users have consistently higher load times than browser users, you may want to optimize the mobile version of your site.
Improving Page Speed
Pingdom can help you pinpoint the source of performance problems. Before implementing a solution, consider where these problems are originating from, how they are impacting your users, and what complications might arise from implementing a fix. Common solutions might include:
Using a Content Delivery Network (CDN)
CDNs serve two key purposes: reduce load on your web servers, and move your content closer to your users. CDNs like Amazon CloudFront will distribute and cache your content in a number of different geographic regions, helping to ensure that distant users can load your website content just as quickly as local users.
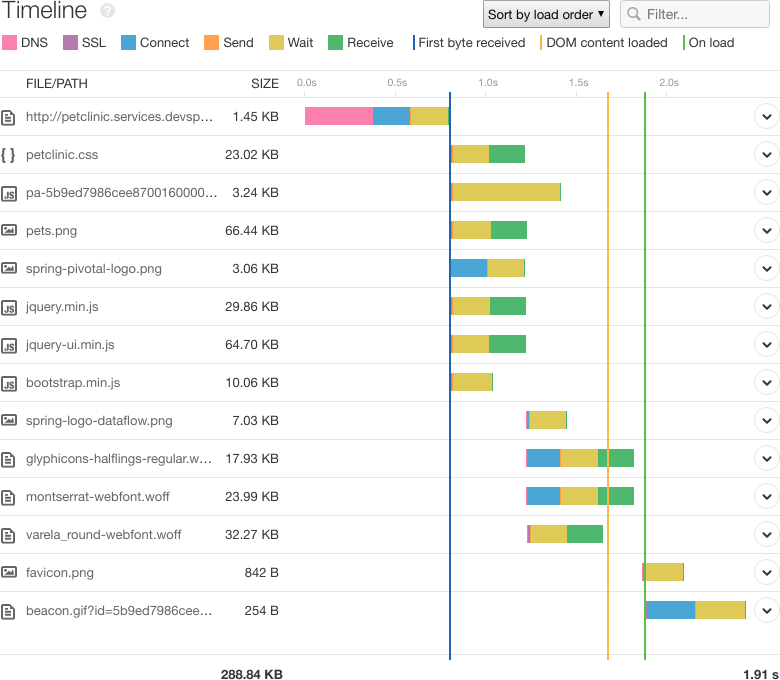
Earlier, we found that our PetClinic website took five times longer on average to load for Australian users than for Eastern US users. To reduce load times, we created a CloudFront Distribution to cache our website’s contents across all CloudFront edge locations, including several in Australia. Enabling this Distribution brought the median page load time down from 2.13 seconds to 1.42 seconds, as shown in the following timeline:
Using web application accelerators
Web application accelerators (also known as caching HTTP reverse proxies) help manage requests between users and web servers. They can generate and maintain cached versions of web pages, including dynamic content. Like CDNs, they are designed to serve users faster and reduce load on application servers. The key difference is that web application accelerators are much more effective at caching dynamic content.
Varnish Cache is a popular open source web application accelerator. We installed Varnish onto our application server and configured it as a reverse proxy. Incoming requests went to Varnish and were forwarded to our web server if the request wasn’t already cached. Simply running Varnish reduced the page load time for our Australian users by over 10%.
Enabling HTTP/2
The latest revision to HTTP made a slew of improvements to client/server communication. In addition to fixing many of HTTP/1.1’s shortcomings, it introduced many new features designed specifically to optimize and streamline transmission. Many web servers and browsers support HTTP/2, and enabling it in Apache or Nginx is very straightforward.
Using Compression
Compression shrinks files into a smaller size without changing their actual contents. Almost any Web resource—HTML, JS, CSS, and images in particular—can benefit from compression, and almost all modern browsers support a number of compression algorithms.
For a more comprehensive list of performance improvements and best practices, see the Page Speed section of the SEO Learning Center provided by Moz.
Conclusion
As computers and Internet connections become faster, user expectations for website performance are only going to increase. SolarWinds Pingdom makes it easy to monitor and identify the source of performance problems. To start managing the performance of your websites, sign up for a free trial and start monitoring your websites today.
The SolarWinds and SolarWinds MSP trademarks, service marks, and logos are the exclusive property of SolarWinds MSP Canada ULC, SolarWinds MSP UK Ltd. or its affiliates. All other trademarks are the property of their respective owners.


