


Seasonality in E-Commerce Comes in Many Forms
Many e-commerce sites deal with seasonality. Trends such as meteorological seasons, or annual events like Christmas, Cyber Monday, Thanksgiving, and more, increase the demand substantially, creating massive sales opportunities at specific peak moments throughout the year.
Source: https://www.datacamp.com/community/blog/thanksgiving-holiday-season
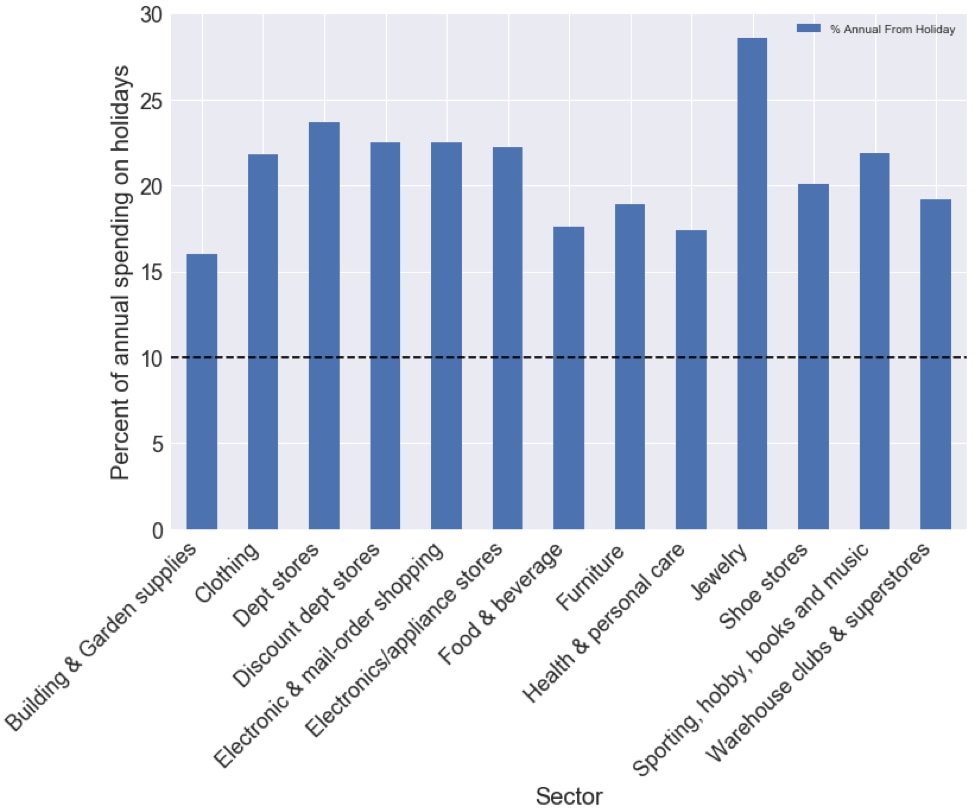
A fair percentage (up to about 30%) of annual revenue can come from just a few, or even a single, peak sales moment (s). These times are perfect for another contact moment with customers, letting them know about the good (or bad) weather forecast to sell BBQ supplies (or rain jackets), or gadgets on sale during the holiday season.
While these high peaks have a great deal of upside in terms of revenue, the high traffic volume may lead to problems with the e-commerce site or other critical components like payment, search, or online shopping cart. Managing the performance and availability of the web application during peak shopping season is no easy task. Thankfully, a number of basic processes and tools can set you up for success.
Performance Monitoring Starts During the Off-Season
First, begin by building a baseline of performance and availability data early on, so you’re aware of what to expect in the future.
Know your important dates throughout the year. These could be tied into specific dates each year or related to meteorological events like the weather. By analyzing search keywords and popular products, you know which products sell in specific conditions. Mark those events on your calendar.
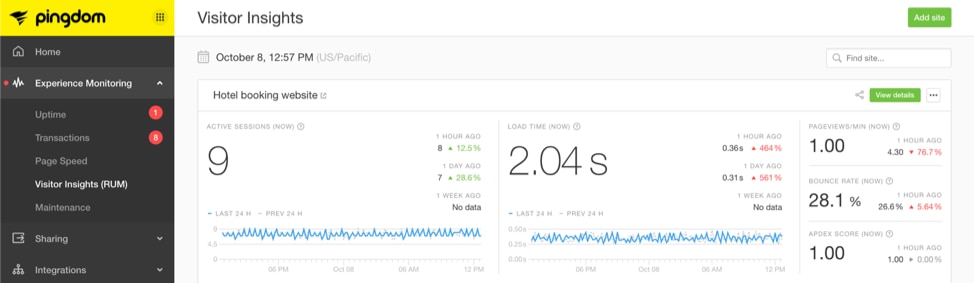
Extrapolate the expectations in terms of traffic volume and load, number of orders, and other key metrics affecting performance and availability from previous years, to set the bar for upcoming dates. Using a website monitoring software like SolarWinds® Pingdom® helps gather this data from actual website traffic. The real user monitoring feature allows you to capture performance metrics and user behavior by region, device, and browser—all elements that can impact the customer’s experience with your e-commerce applications.
Armed with this information, we can keep a close eye on the dates or specific conditions so we know a peak is coming. With the list of upcoming events and an expectation of peak load, we can start planning and optimizing the site.
The great thing about a tool like Pingdom is the amount of insight the data gives. Along with using the monitoring data to know what peaks to expect, we can also use it to drive optimization of the user experience and website performance, and also to let us know the moment an application is down or a transaction has failed.
Performance issues related to anomalies in the amount of site traffic can be mitigated by reducing the load each user creates on the back end; more users can be served with the same resources. A good starting point for these optimizations is the key transactions in the system. These key transactions include search, basket, adding products to favorites or lists, and of course, checkout. Transaction monitoring can help teams quickly identify failed transactions, whether they’re because of performance issues or failed code, before they impact paying customers.
Having a strong monitoring strategy 24/7, 365 days a year, is important. All the same issues apply; it’s just magnified exponentially during peak shopping seasons and can have a major impact on a company’s performance for the entire year.
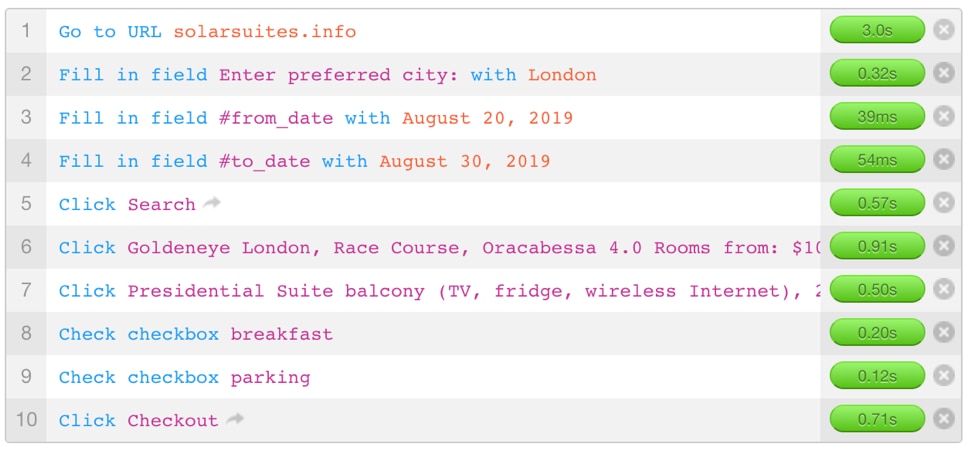
Pingdom provides both synthetic and real user monitoring for web applications and mimics the flow and key transactions to gather performance data on different parts of the site. This way, we see performance data for components like the landing page, login page, search results, product page, basket, and checkout. Pingdom does a great job of providing an outside-in, client-side perspective of availability and performance of your e-commerce applications.
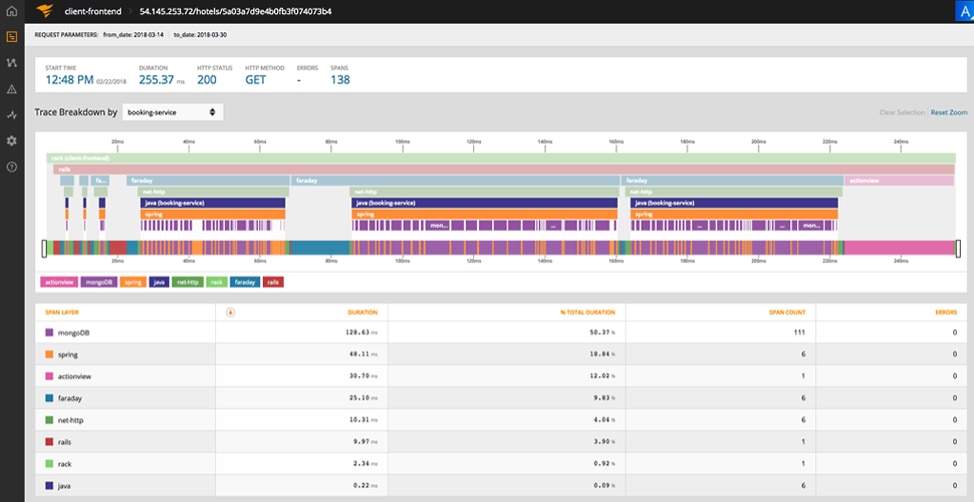
Combining the client-side monitoring with server-side monitoring provides a complete picture of your web application’s availability and performance. With Pingdom, you’ll know when there’s a problem and where it is. Server-side monitoring provides the “why” and guides you on what needs to be fixed. This granular view of a site’s internal parts is incredibly helpful in finding bottlenecks and solving performance issues. But finding the contributing factors and root cause of these bottlenecks and issues often requires a deeper level of insights into the application across the stack. For that, a tool like SolarWinds AppOptics™, which provides the server-side monitoring, allows teams to dive into the underlying application and server infrastructure to see what code is causing the bottleneck and pinpoint the issue.
Optimizing User Experience in Real Time During Peaks
With both tools in place and practices for continuously finding and removing performance bottlenecks, we’re ready for prime time. During peak moments, real-time insight into the availability, performance, and potential bottlenecks is crucial. When performance is poor the application might as well be down, so both need to be monitored. Teams need to be alerted the moment there is a failure or when performance exceeds acceptable thresholds. This enables them to respond quickly to any issue, and fix the problem before it impacts your customers and revenue.
Remember—for many companies, there are only a couple of events a year that make up the majority of the year’s revenue, so user experience during these moments is non-negotiable. It’s during these times that application availability and performance issues will have the most profound effect on your bottom line. Knowing what performed well in the past, what issues you’ve experienced during the year, and understanding recent changes by looking at the monitoring data are important for real-time triaging during peak loads.
Start Optimizing Now
Do you know that phrase ‘the best time to start was a year ago, but the second-best time is now’? That’s how web application monitoring works, too. There are two key reasons for starting your monitoring journey today:
- You can start gathering data, monitoring key applications and the most critical transactions, and discovering trends in seasonality and website performance.
- Monitoring is a 24/7, 365 days a year effort. It’s important to continue building your skills and experience by ‘practicing’ optimization throughout the year, paying special attention to these crucial times for your business.
Having visibility into application performance and infrastructure health through the right combination of tools is key in optimizing user experience, removing bottlenecks, and finding contributing factors to performance issues. This is especially important during peak seasons, because the amount of revenue at stake requires rapid troubleshooting, quick thinking, and a well-oiled triage to minimize revenue and customer losses.
Regardless of what tools you use, they can be the difference between celebrating a great holiday season and trying to explain why your application’s availability or performance issues reduced your capability to cash in on another peak shopping season.
Learn more about Pingdom and other tools in the SolarWinds APM suite.


