A while back we delivered a report on social media demographics as they stood in 2012. Now, 5 years on, things are looking different: some have been all but consigned to the Internet mausoleum that is Archive.org (may they rest in peace) whilst others have shot into the limelight.
Of course, the main players like Facebook, Twitter and YouTube are still going strong but one thing we’ve gleaned from this year’s report is that today, everything is bigger.
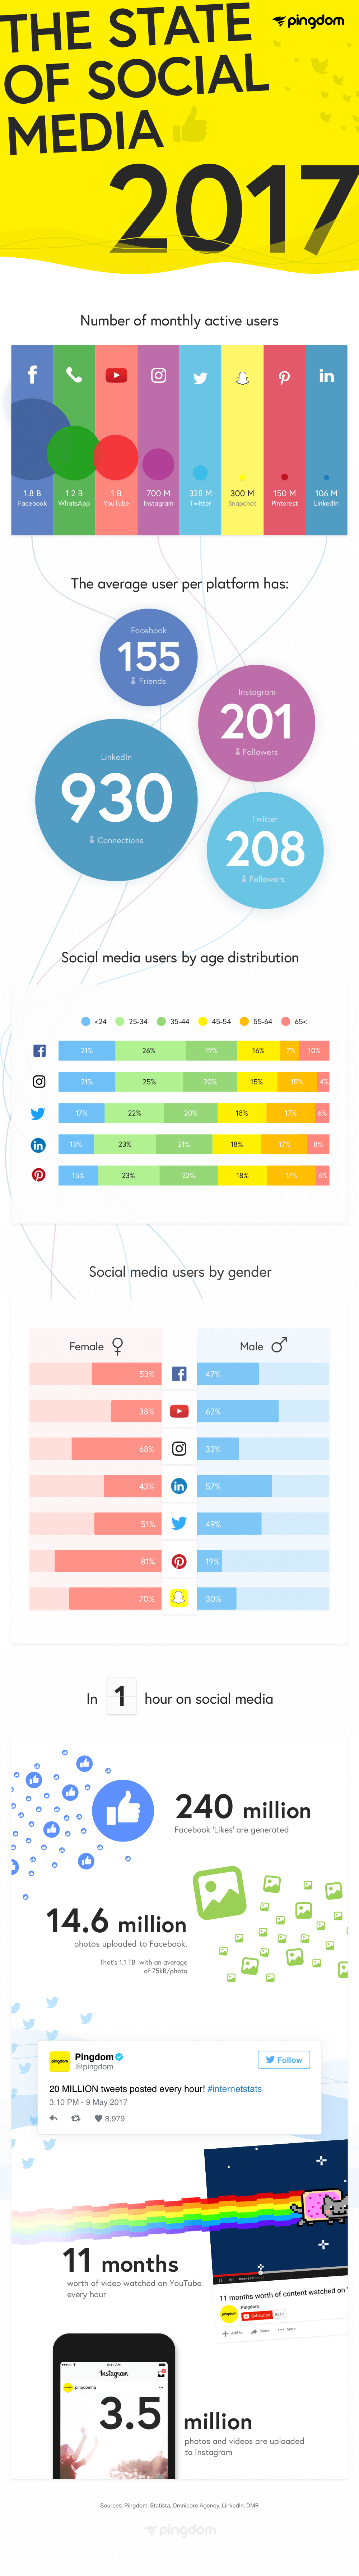
We’ve collected the data for 7 of the biggest social media sites today to help you answer questions like how many active users sites like Facebook and Instagram have every month, how old the average Twitter user is and whether LinkedIn is more popular with men than women.
 Facebook
- MAUs: 2012: 1 billion. 2017: 1.8 billion.
- 25-34 year olds make up the majority of users.
- The number of friends an average user has is 155.
- 53% of Facebook users are women and 47% are men.
- 240 million likes are generated and 14.6 million photos are uploaded to Facebook every hour.
 Twitter
- MAUs: 2012: 200 million. 2017: 328 million.
- 25-34 year olds are the predominant users of the service.
- The average Twitter user has 208 followers.
- 51% of Twitter users are women and 49% are men.
- 20 million tweets are posted every hour.
 Instagram
- MAUs: 2012: 90 million. 2017: 700 million.
- 25-34 year olds are, again, the main users of the social network.
- The average Instagram profile has 201 followers.
- 68% of users are women and 32% are men.
- 3.5 million photos and videos are uploaded to Instagram every hour.
 Snapchat
- MAUs: 2012: 18 million. 2017: 300 million.
- 18-24 year olds make up 45% of the total Snapchat users.
- The average Snapchat user spends 25-30 minutes using it daily.
- Approximately 70% of Snapchat users are women.
- 31.6 million snaps are created every hour.
 YouTube
- MAUs: 1 billion in 2017
- 62% of users are men and 38% are women.
- 40 minutes is the average session time on Youtube.
- 91% of 13-17 year olds, 72% of 18-34 year olds and 58% of 35-50 year olds in the US actively use YouTube.
- 11 months of video are watched every hour.
 LinkedIn
- MAUs: 106 million
- 57% of users are men and 43% are women.
- The average LinkedIn user has 930 connections.
- 36% of LinkedIn users are 34 years old or younger.
- 10,800 new members join the social network every hour.
 Pinterest
- MAUs: 150 million
- An overwhelming 81% of users are women.
- The median age of Pinterest users is 40 but the majority of active pinners are <40.
- 60% of Pinterest users come from the US.
- 583,000 items are pinned on Pinterest every hour.
- The average time spent on Pinterest per visit is 14.2 minutes.
Impressive, isn’t it? Facebook still dominates the social media landscape, with nearly 23% of the world’s population using the social network! Instagram’s monthly active user base increased by over 670% from 2012 to today and it shows no signs of slowing down.
Of course, data always looks better visually, which is why we’ve collected all the best bits into the beautiful infographic below. Save it, share it on social media or stick it to the wall of your office!