


We love to measure and analyze the web performance of sites here on the Royal Pingdom blog. It’s time to revisit the web performance of the world’s top 50 blogs. It’s worth pointing out that one important finding of this 2016 study, was that it is really hard to define what is considered a blog. When we did a similar analysis of blogs in 2012 we used the, now deprecated, Technorati list of the biggest 100 blogs.
What are blogs, and shouldn’t they be called publications? The line is blurry, and most listings of big blogs have Huffington Post in its top-3, and if that’s okay then surely other aggregated sites, like Medium, could be considered blogs as well.
Publication or blog, let’s focus on what we do know: Web performance. You can read about the methodology of the tests below.
As expected, performance among these top 50 publications is quite the mix. There are sites that are small, fast, big, large, and everything in between. We have all the numbers and charts for you.
How we tested the web performance
We based our test off of the 50,000 biggest websites in the world according to Alexa. Then we determined which of the 50,000 websites are in fact publications or blogs. For each website, we ran it through our Pingdom Full Page Test to collect data about how fast it loaded, how big the homepage was, and more. In all we did two tests per blog over two consecutive days, February 9-10, then calculated the average of the tests.
Blogs and publications inherently have content that will change frequently, often on a daily basis. Therefore, there will be differences in the types and number of articles posted, whether they include pictures, videos, etc. All these factors, and many more, affect the performance of the site.
Page size ranged from 617 kB to 20 MB
Let’s start with the size of each site’s homepage. The average page size of the top 50 blogs was 4.82 MB. This is an increase from the average 2.10 MB homepage size we found when we studied the top 100 blogs in 2012. It’s also a big jump from the 934 kB in average size we found in 2008.
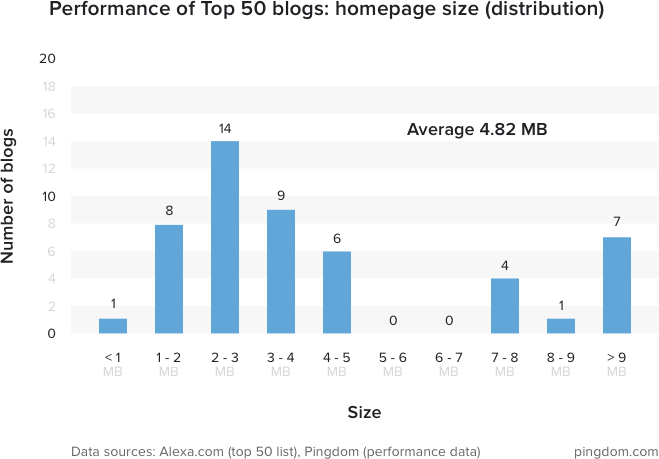
The size of the homepages ranged from 617 kB (torrentfreak.com) to 20 MB (tmz.com). Meaning the largest site was around 32 times bigger than the smallest one.
It’s worth noting that only 9 out of the 50 blogs was smaller than 2 MB.
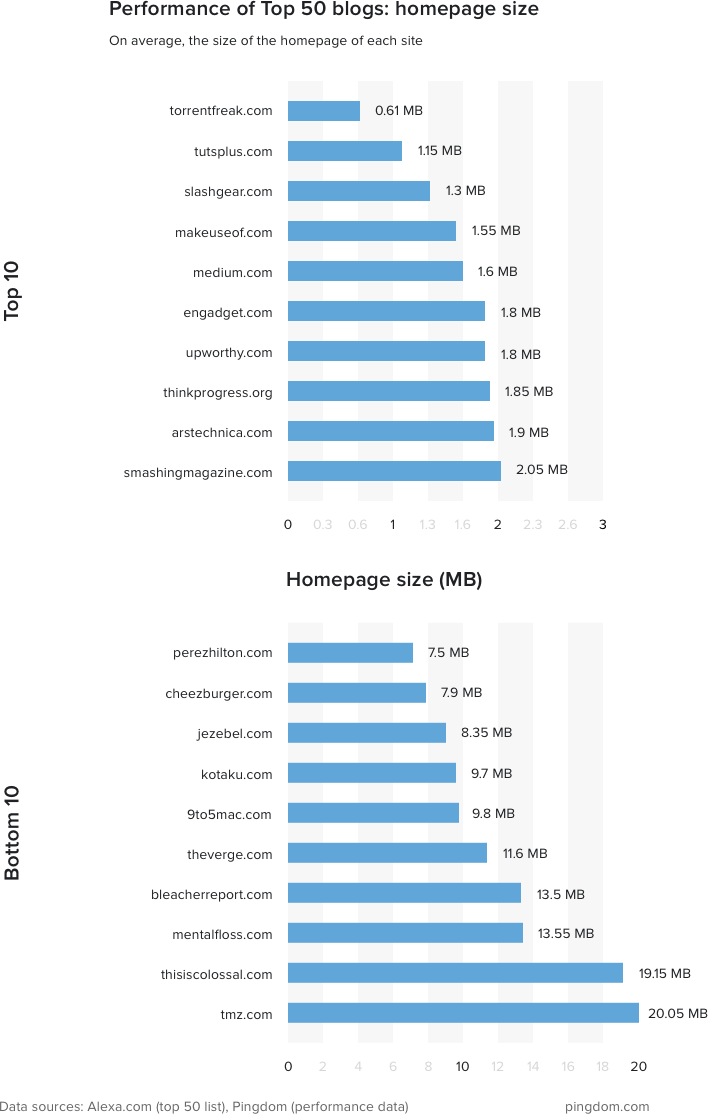
In the following chart you can see the top and bottom 10 blogs in terms of homepage size:
Fastest site loads in just under 1 second
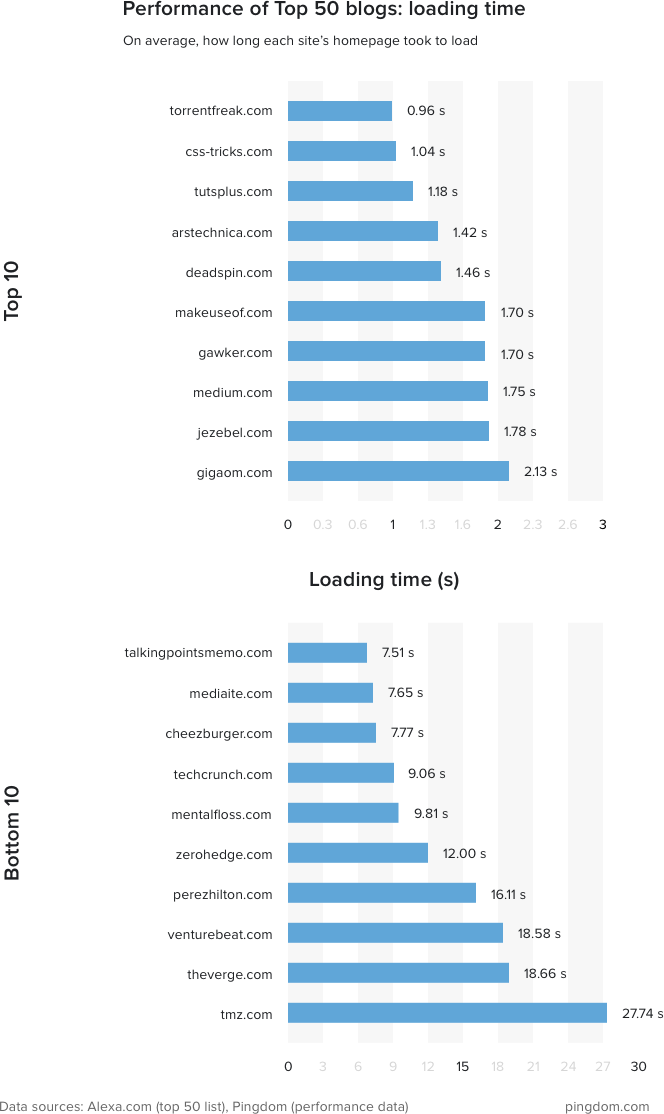
The smallest homepage, torrentfreak.com, was also the fastest and the only site loading faster than 1 second. It’s worth giving an honorable mention to css-tricks.com with a load time of 1.04 seconds despite being in the bottom half in terms of size.
Here’s the distribution of loading times in the top 50 blogs:
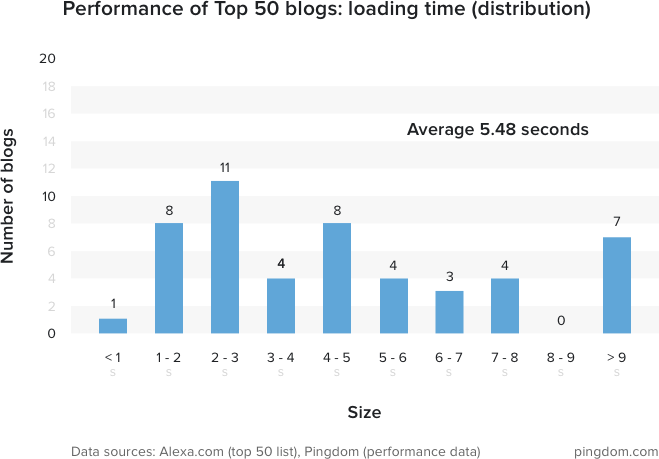
A majority of the sites (32 of the 50) are faster than 5 seconds, and the average loading time across all sites was 5.48 seconds.
While torrentfreak.com was the fastest, followed by css-tricks.com and tutsplus.com, the other extreme was tmz.com which finished to load, on average, in 27.7 seconds!
Let’s put it this way: the fastest site could load almost 29 times in the same amount of time that the slowest site loaded just once. Here are the 10 fastest and the 10 slowest sites:
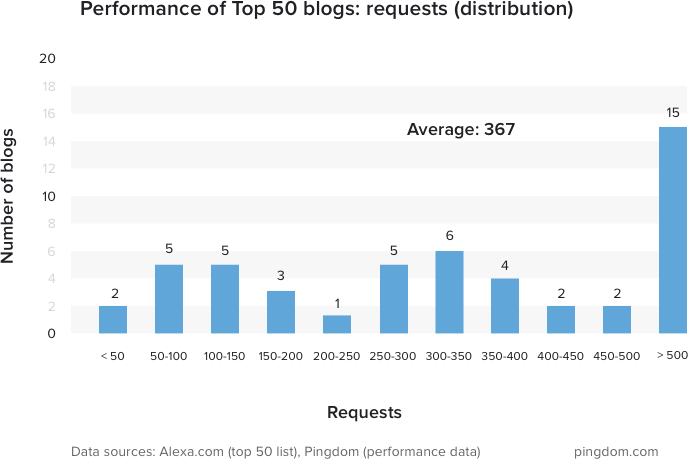
So. Many. Requests
Finally, let’s address the number of elements that a site requests when a user is loading it in their browser. This would include JavaScript files, CSS files, images, etc.
The average number of elements loaded by the top 50 blogs was 367. An increase from 216 requests in the 2012 study. Here’s the distribution of the number of requests per blog.
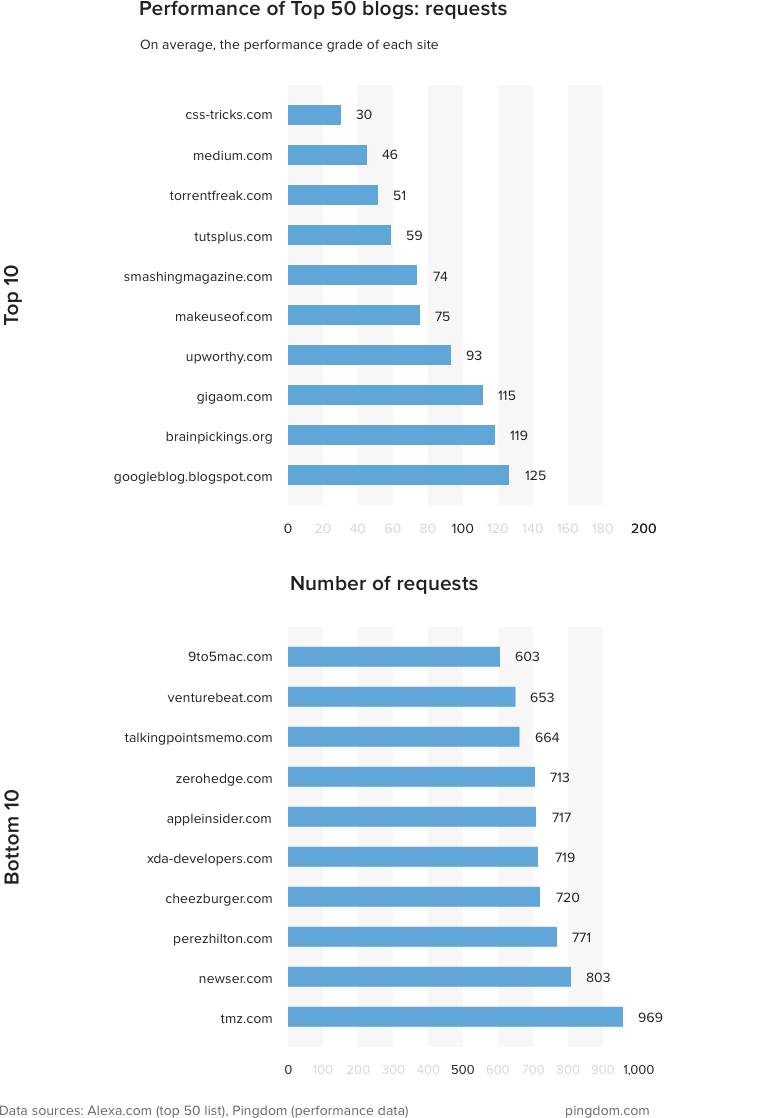
The second fastest site in this test, css-tricks.com, was the site that loaded the fewest elements with only 30 requests. And at the other end of the chart we have tmz.com with a mind-boggling 969 requests. It’s worth mentioning that the Pingdom Full Page Test crashed a few times because of the poor performance of TMZ. Well played, guys.
To put it in a different perspective, get a load of this: the site with the most requests, loaded 32 times as many elements as the one with the fewest requests.
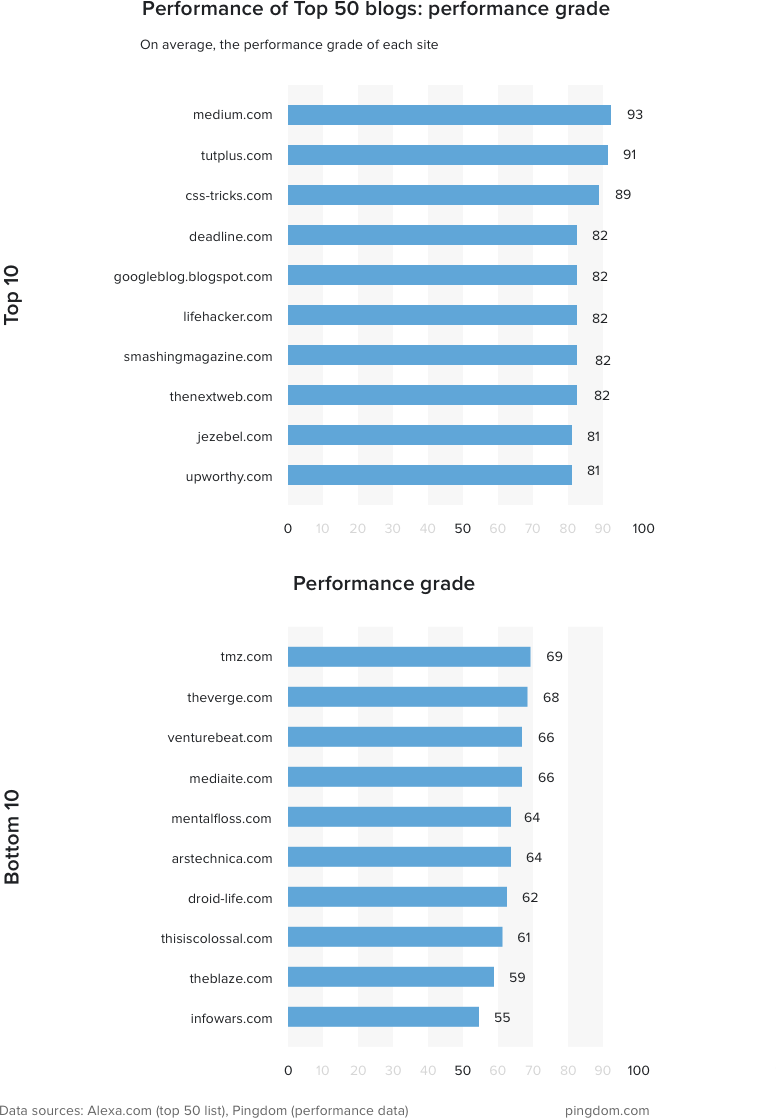
Performance grade
The performance grade tells us how a website conforms to performance best practices from Google Page Speed. We got very impressive results during our tests from medium.com (93) as well as tutsplus.com (91) and css-tricks.com (89). These websites all scored very high across all tests, so a round of applause for the teams.
Plenty of room for optimization of web performance
Chances are you visit one or more of these sites on a regular basis. Does their speed affect which ones you return to more often than others? The speed of a site plays a major importance in e-commerce, where time really is money, that much we know.
We certainly find it interesting to dig into web performance data like this to get a sense of how these top sites function and what kind of experience you might have when you visit them. Even though the results are mixed, one thing is certain: there is a lot of room for optimization in many of these popular blogs.
Why don’t you run your site through our Page Speed test and see how it compares with the top 50 blogs and other sites? The Page Speed Check is available in our dashboard when you continuously want to test your website’s performance.


