


You can think about a website the same way you think about your car. Every time something breaks, a professional—an engineer or a mechanic—usually charges a high amount for the fix (isn’t it annoying when you can’t tell if it’s a big or small fix?). Alternatively, you can learn some basics, get a few inexpensive tools, and troubleshoot many of the immediate issues yourself.
The truth is web performance issues are relatively easy to understand once translated into plain English. You could read Richard Stevens or try navigating Wikipedia’s website monitoring related repositories. Still, the reality is you don’t need more than a few basic concepts to be able to tell what went wrong with your website and why. With that in mind, let’s start by understanding where your website is in the big (internet) picture.
DNS is Like a Phone Book
[Note: if you are familiar with DNS, skip to the Traceroute section].
Your website and all its pages live on a web server. When your website is down, you’ll first want to know if the problem is close to home (aka, on your web server)—and possibly under your control—or if it’s somewhere else on the network.
How is your web server found on the internet? Every machine has an IP address that uniquely identifies it on the internet. It’s a four-part number, for example, 192.142.254.15, as you already likely know. When computers communicate, they use IP addresses exclusively. However, because these large numbers are not convenient for humans, a convention was created to match each IP address to a human-readable domain name.
When you type a URL into a browser, for instance, www.google.com, your computer uses DNS to translate https://www.google.com into the IP address, in this case, 172.217.204.147. DNS is often compared to a phone book, in which every computer has a domain name and an IP number.
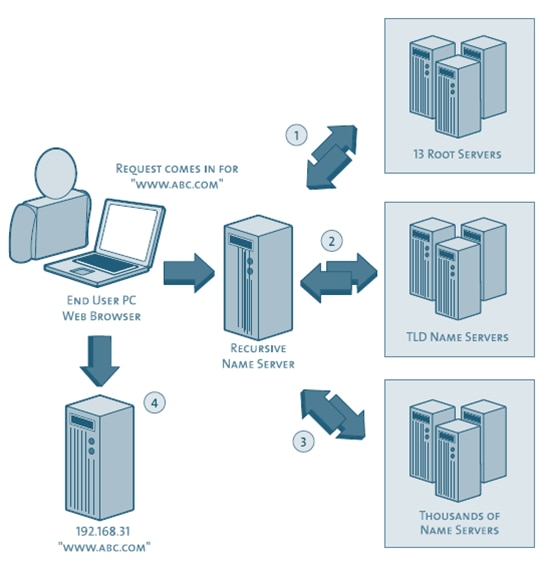
Now that we know what an IP address and DNS are let’s bring up another common term: host. A host is any device connected to a network that can communicate with other devices on that network. In the context of a website, a host refers to a computer or other device connected to the internet, in other words, a machine that is part of the domain name system. It is worth mentioning here that domains contain host names: a fully qualified hostname comprises a machine name and the domain name,
Ex. games.yahoo.com. It’s more complicated, but for our purposes, think of DNS as a phone book for every machine on the internet containing its domain name and a corresponding IP address.
The first step in figuring out why your website is down is checking the domain name matches an IP address; in other words, your domain name is listed in the DNS “phone book.” Similarly to a phone book, there are times when the DNS is not up to date. This process is called “resolving the IP address,” and is a good first step on your web diagnostics path.
If resolving the IP address takes too long, you can assume you have isolated a likely cause of your website’s downtime. This is where you’ll need to contact your web hosting company or system administrator to resolve the issue.
Traceroute–The Internet’s Traffic Report
Another possible reason your website is not available to users is a bottleneck or outage somewhere along the path from their computer to your web server. Investigating the location of the outage is essential to understanding the gravity of the issue, when it is likely to be resolved, and what you can communicate to your users.
Now, how to locate the bottleneck?
The Internet is a network of laptops, desktops, servers, routers, switches, mobile devices, or, hosts. Each has an IP address and is discoverable via DNS. We can imagine every one of these devices as a node in the network, with information traveling across the network from node to node–much like a person might drive from one city to the next. A person cannot drive from Los Angeles to New York without traveling through many other cities, so data must travel across many network paths and routers to reach its destination.

While tracing the problem across this many routes may seem complicated, the great news is that there is a standard utility/command available on the operating systems of all these machines, and it’s called—if
you have not yet guessed—traceroute. Traceroute traverses the network and reports information on transit times, much like a traffic report does.
How Traceroute Works
Information travels across the internet in small packets, which go from the source machine to the destination machine through many nodes on its path. For example, for you to be able to see your website, data packets from your web server have to be able to reach your computer.
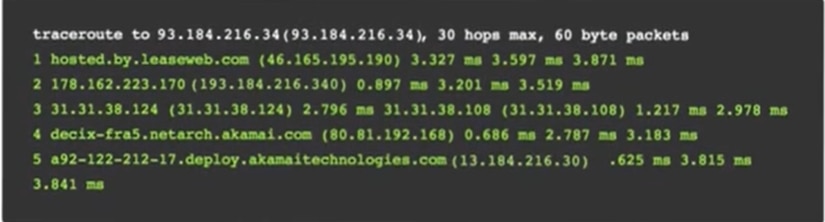
Traceroute measures the health of the connection by calculating the total round-trip time the data packet took to travel between your computer and a node. If the total time recorded on any of these rows is too long compared to your expectations, you know you have found the culprit node.
Occasionally, instead of a row with helpful information, you’ll get a row of three stars:
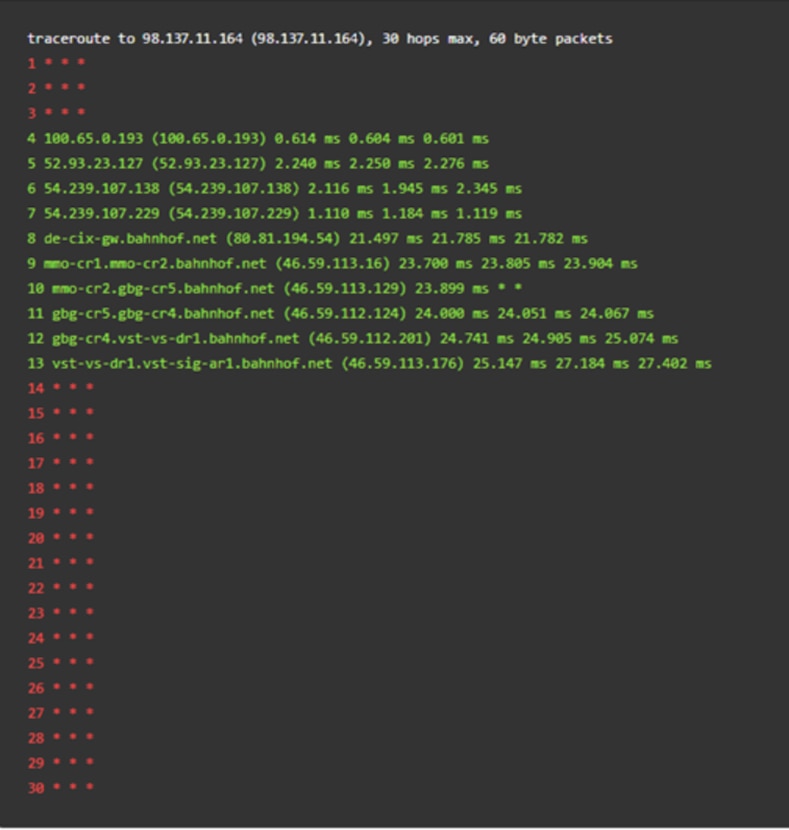
This usually means the node is behind a firewall, purposefully hidden by the company or individual who owns it. If traceroute returns a few such rows and continues tracing the path within a minimal timeframe, you can continue your analysis as is. If the time between the node before the starred lines and the node after is too long, the culprit might be the server behind the firewall.
When traceroute stops routing to more nodes it has reached the destination node (your website’s server). Each of the data packets traceroute sends contains source and destination information, and once the destination information matches that of a node, the search is over and traceroute stops. A counter system, time to live (TTL), works behind the one-at-a-time node hopping and returns, determining the amount of time a data packet should exist on a network or computer before being discarded. However, there is no need to get into that much detail here.
What matters is that traceroute will show the health of each machine along the path from your machine to the web server. You can also find geographical information about each node using simple online or operating system tools.
Let’s say the majority of your customers are in North America. If you find out your web performance is affected because a major server in Prague is down, you may not be as concerned as you would be in case of a server outage in Virginia.
More Testing—Better Results
Now that you understand how traceroute works, you can see how it can help identify where your network path broke down. However, you’d be right to ask how this helps if you’re running a website with millions of users/customers worldwide. Won’t all the paths from their computers to your web server differ? And if so, how do you test them?
The simple answer is that you should perform traceroute tests from many different spots worldwide. While this would be overwhelming for each individual or company with a website, solutions like SolarWinds® Pingdom ® tools are designed for these operations for a nominal monthly fee. These solutions offer networks of many machines worldwide that will perform DNS and traceroute tests at scale, as often as every minute.
Check out this Pingdom blog if you want a deeper dive into how DNS works. For an overview of how to use Pingdom to troubleshoot uptime issues, visit the uptime webpage. For a real hands-on experience, start your free SolarWinds® Pingdom® trial today.


