


As anyone with some experience running web applications will tell you, page speed is one of the most critical aspects to monitor.
Page speed has a major impact on the user’s behavior. Will they stay on the site and complete the purchase, order, or transaction? Will they recommend the service to others?
Bad page speed directly impacts conversion and revenue, so your web app’s page speed should be top of mind. This is equally true for e-commerce (auction, retail), customer support, educational (video training), news sites, and online banks.
What is Page Speed?
Let’s take a step back and figure out what we’re looking at. At its simplest, page speed is a measure of how long it takes for a specific page to load.
There are technically different ways to measure page speed:
1. Page load time is a measure of how long it takes to fully display the content of a page.
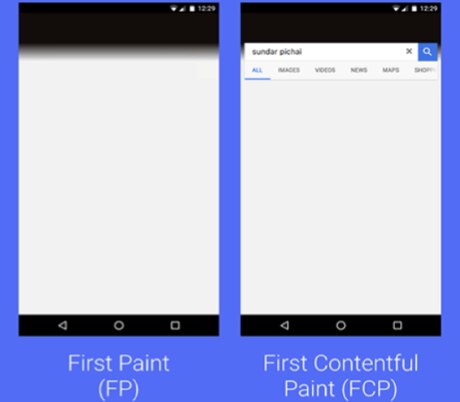
2. First Contentful Paint is the point of first rendering of content by the browser, after loading HTML and DOM, including text and images.
3. First Paint is the point at which the first pixel renders on a screen.
Many search engines use site speed to determine ranking of pages for a search query, so optimizing site speed goes beyond user retention and is important for attracting new visitors through search engines. A rudimentary way to evaluate your page speed is with PageSpeed Insights from Google. A better way to evaluate page speed is to use SolarWinds® Pingdom® and its page speed monitoring feature, which evaluates page speed continuously and granularly. It also makes it easy for you to put page speed monitors on all your most critical web application pages, so you can be aware of any one of those pages performing poorly before it impacts your users.
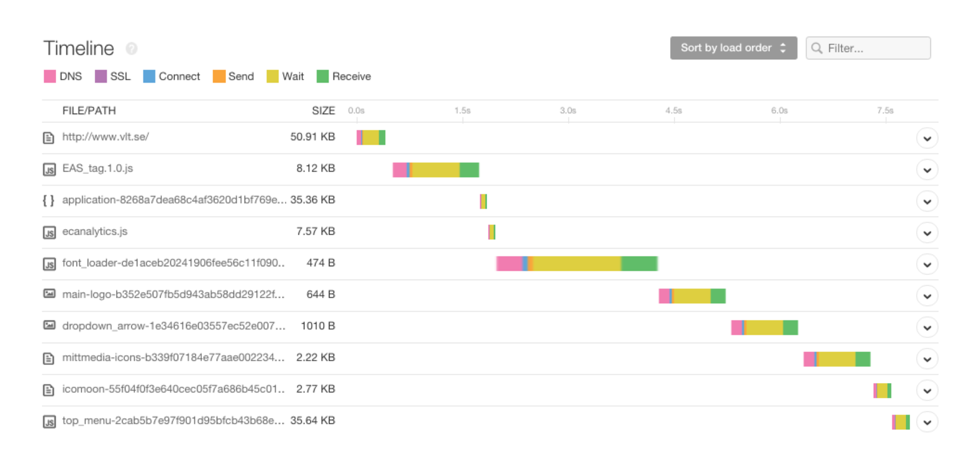
Many things influence page speed, both good and bad. Often, the small code optimizations and other details matter the most, so it’s imperative to set up monitoring at this detailed level to be able to see where bottlenecks lie and how to solve them. This is why specialized tools like Pingdom exist: they provide the level of detailed monitoring needed to be able to improve page speeds.
Commonly, improvements can be found in these areas:
1. Optimizing data (compression, minifying, media resizing)
2. Using edge services for content delivery
3. Removing legacy and unused code, plugins, and third-party scripts
4. Reducing errors and timeouts, including those from third-party APIs and scripts
Monitoring your site helps identify bottlenecks, slow-loading components, and errors, so you know what to improve. Here are six practical tips to improve page speed.
1. Use a CDN with connection optimization and local edge delivery to serve content and images to your users. The CDN uses locations closer to the user to serve content, improving latency, reducing bandwidth, and reducing the number of requests by re-using connections. CDNs often offer other services to improve page speed, some of which are listed below.
2. Minify JavaScript, CSS, and HTML files. Developers write human-readable code, but browsers parse minified code faster. Minification minimizes the amount of code by crunching comments, spacing, and variable names. Often, minified files are then compressed to reduce the file size even further.
3. Use compressed image formats and automatically resize them during the authoring process to the resolution used on the site, to prevent larger-than-necessary images.
4. Use monitoring to identify errors, slowness, and time-outs in Javascripts and third-party code, including remote APIs. Use tools like SolarWinds AppOptics™ for code-level root-cause analysis to find the culprit quickly.
5. Identify legacy or unused code by using visual representations in the monitoring tool to see what’s used, and hunt for unused code.
6. Reduce the number of plugins and third-party scripts and code to improve performance. For the plugins and third-party scripts you still use, analyze performance of each plugin and third-party included by disabling temporarily and measuring the difference in page speed.
For many improvements, it’s important to have a baseline of performance as well as a continuous stream of monitoring metrics to be able to identify trends as you’re applying fixes to improve page speed. A great resource to get started is the Pingdom help page on page speed checks.
Learn more about Pingdom and synthetic page speed monitors by trying it out. You can set up page speed checks in just minutes, and Pingdom comes with a free 14-day trial.


