


In the push to make the web more accessible, performance is key. Websites are becoming bigger and more complex than ever before, placing a toll on both servers and clients. However, website performance is vital to attracting and keeping users engaged. In this article, we’ll explain why web application performance is important and how you can analyze it and troubleshoot problems using SolarWinds® web application performance monitoring solutions.
Why Monitoring Performance is Important
Performance has a direct impact on conversions. For example, BBC found that they lost 10% of their user count for each additional second a page took to load. Google found that 53% of web page visits are likely to be abandoned if a page takes longer than three seconds to load. With so much riding on performance, tracking performance problems is a necessity. The reasons for website performance monitoring are threefold:
- Monitoring availability – Monitoring availability tracks performance over time, helping you identify slow periods or downtime.
- Investigating performance problems – In the event of a performance drop or downtime, you want to know when and where it occurred. Performance monitoring tools record the actions taken by your application, allowing you to search for inconsistencies.
- Finding the root cause – Changes in performance affect usability, traffic, and conversion rates. Performance monitoring lets you highlight these differences so you can better address them.
To demonstrate the usefulness of performance monitoring, we deployed the Spring PetClinic application on a Kubernetes cluster. We deployed the web application in a Pod and connected it to a MySQL database running in a separate Pod. We then scheduled randomized requests to different webpages, creating simulated traffic.
Monitoring Availability
Uptime and responsiveness are two of the most important metrics when hosting your website. Users must be able to reach and load your site in a timely manner. Increased demand, exhausted resources, database errors, and other scenarios can occur at any time, and will significantly affect performance. Additionally, websites can load quickly for users in one geographic region, but slowly for those in another region. To help ensure the best experience for your users, you should be monitoring your website’s availability over time and from multiple geographic locations.
One of the most popular performance monitoring solutions is SolarWinds Pingdom®. Pingdom provides a number of tools for monitoring uptime, page speed, transactions, and real user monitoring (RUM). Running an uptime check in Pingdom lets you track your website’s availability, accessibility, and responsiveness over time.
For our web application, we created a check to monitor our website every five minutes. Over the past 24 hours, the response time remained stable at around 300ms. However, the site recently experienced 25 minutes of downtime, as shown in the following chart:
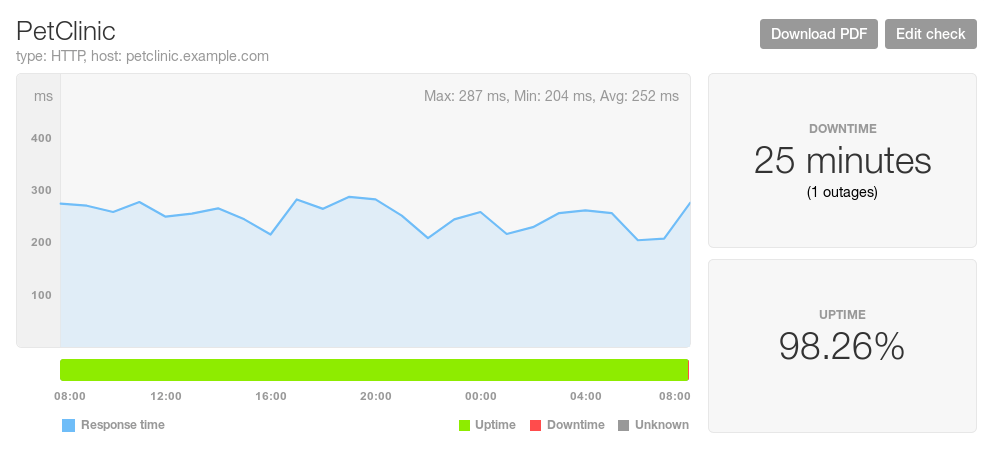
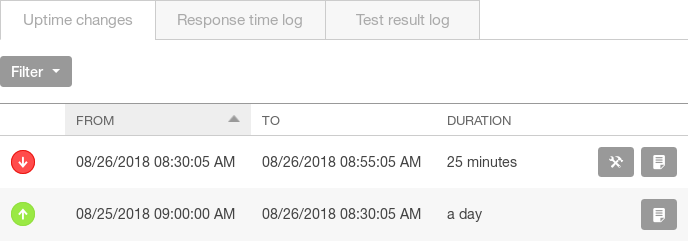
The questions we need to ask are: When did this change occur, and what caused it? To find out when it happened, we can place the mouse over any point on the graph to see a tooltip showing the exact date and time of the measurement. We can also see when the response time changed by scrolling to the “Uptime changes” table underneath the graph. This table lists each change in the website’s availability, as well as the date and time of the change. Using this table, we can see that the check failed around 8:30 a.m., and that the website has been unresponsive up until the most recent check at 8:55 a.m.:
Uptime checks can tell us whether a web service is reachable and how responsive the web service is, but they can’t tell us how the service itself is performing. We don’t know if this downtime is due to the application, the database, or our infrastructure. In order to dig deeper, we’ll need to turn to application performance monitoring tools.
Investigating Performance Problems
The challenge in troubleshooting performance problems is knowing exactly what the application was doing at the time of the problem. This requires a tool that can measure and track the application’s internal actions.
Application performance monitoring (APM) is the practice of collecting metrics about applications and the environments they run in. This includes tracing transactions through code, tracking hardware resource usage, recording database queries, and detecting errors. With APM, we can see exactly what part of our web application is causing or contributing to its downtime.
We’ll use SolarWinds AppOptics™ as our APM tool. AppOptics is a comprehensive solution for APM and infrastructure monitoring. AppOptics collects metrics through agents which run in applications and on host systems, allowing us to trace transactions throughout the application and identify bottlenecks at code level.
To get as close to the source as possible, we ran the AppOptics Java agent in the same container as our web application. Although AppOptics supports Kubernetes integration, running an agent in the same container lets us collect metrics directly from the Java Virtual Machine (JVM) that the web application is running in. This lets us record calls between individual methods in the application code, track memory usage, and record any errors that might cause the application to crash. This also lets us trace calls to the MySQL database, despite it running in a completely separate Pod.
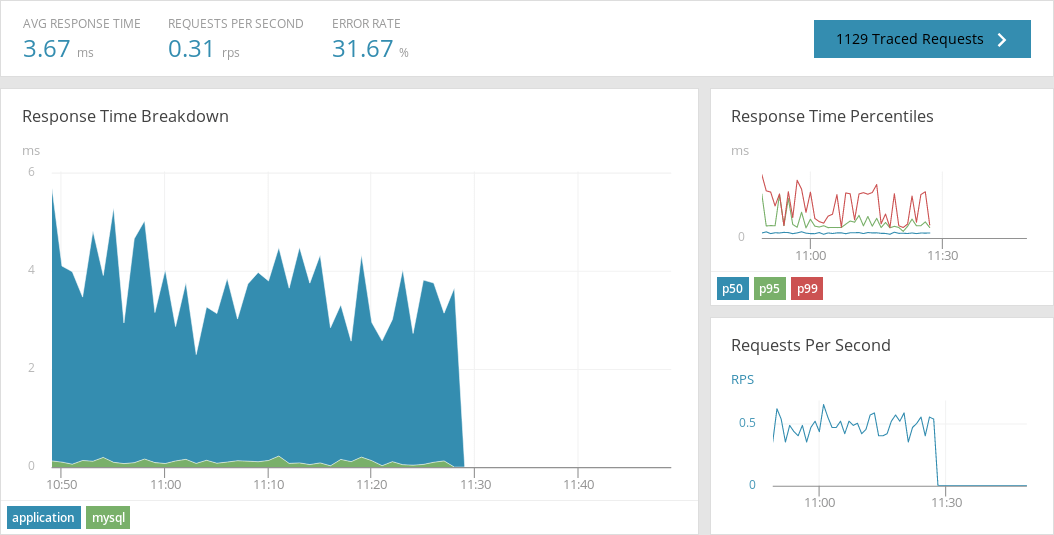
To try to get our web application running again, we shut down the Pods currently running on Kubernetes and re-deployed them a few minutes later. You can see this in the screenshot below as indicated by the drop in response time:
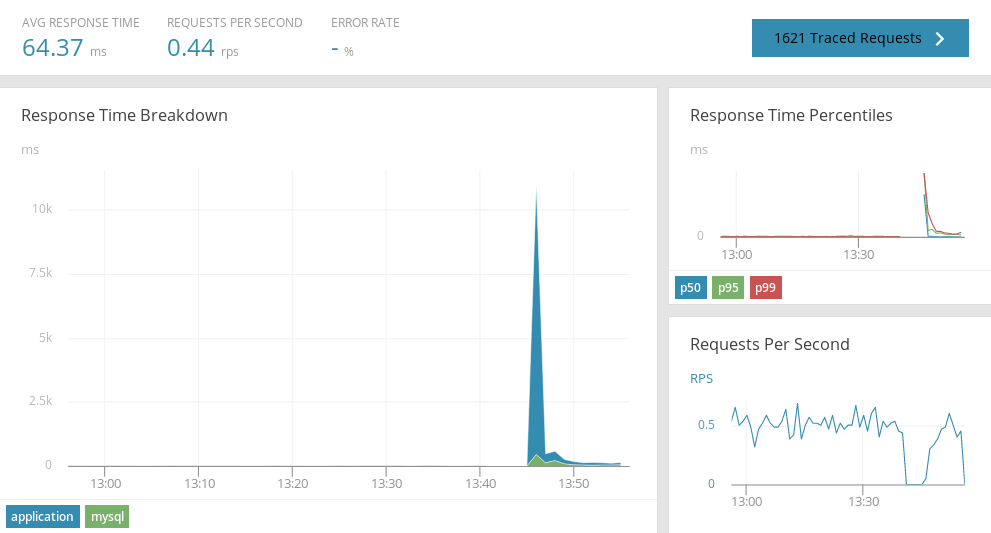
Next, we restarted the application. While the application was restarting, the AppOptics agent recorded the response time as indicated by the enormous spike shown below. After this initial spike, the response times fall back to a relatively low average:
The AppOptics agent also records periodic transaction traces throughout the application. Clicking on the “Traced Requests” button in the top-right corner of the screen shows a list of requests sorted by response time. After sorting by time, we can scroll down to the request that occurred just before the application became unresponsive and view the trace in greater detail.
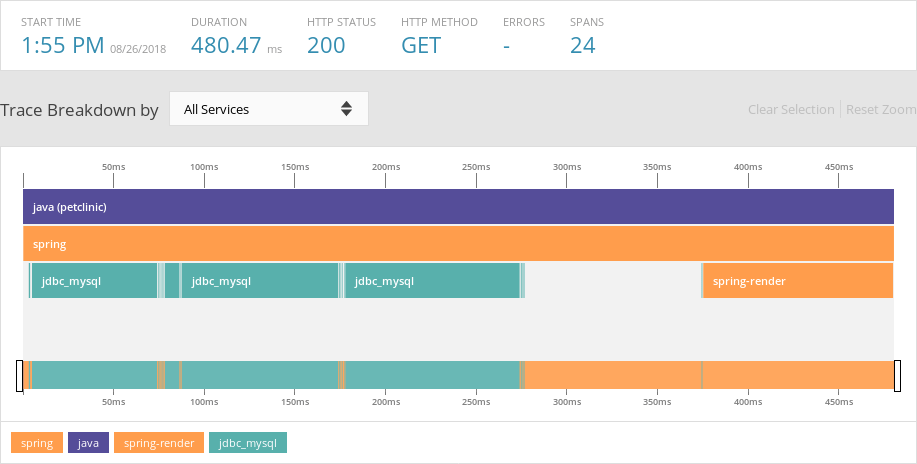
The problem appears to be caused by a call to the MySQL server, as shown by the jdbc_mysql span in teal. AppOptics provides a number of ways to troubleshoot MySQL problems and other issues like this, including the ability to find out which container ran the query, see details about the host machine that the container ran on, view the raw query, and see any backtraces produced by the call. But to truly get to the root of the problem, we need to dig a bit deeper.
Finding the Root Cause
In the era of APM and real-time monitoring, logs are often the most detailed source of information. The problem that many engineering teams face is the lack of a good log management solution. Without a way to process logs, engineers are left with the impossible task of manually searching through log files.
Log management solutions provide the tools to collect, analyze, and aggregate large volumes of log data automatically. Not only do they help you search through logs more quickly, but you can also parse, monitor, and visualize your logs. We used Loggly® log management software to collect log data from our web application. By deploying a Logspout DaemonSet, we were able to instantly start logging our entire Kubernetes deployment with a single command.
Let’s try searching for logs related to changes in website responsiveness. After opening the Loggly website, we can use the search box to filter logs to those originating from our application. We can further refine this search to only show logs with a severity of “Error.”
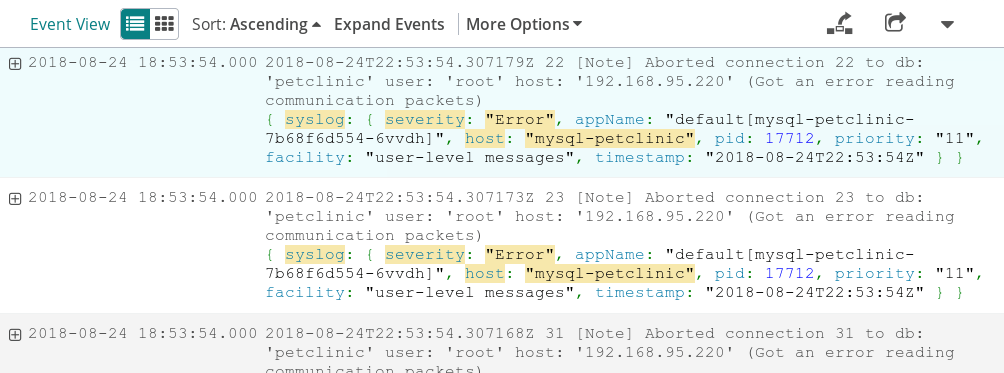
Now we can start to see the cause. With the database refusing connections, the web application can’t fulfill requests, leading to slower response times and more errors. As it turns out, we set a hard CPU and memory limit for the database Pod, but we may have set this too low. In this case, the fix is simply to increase the Pod’s resource limits or its replica counts so that it has room to grow.
Without these tools, fixing this problem would have taken far more hands-on investigating and troubleshooting. Using SolarWinds web application performance monitoring solutions, we were able to quickly identify the cause of the problem without having to connect to the Kubernetes cluster.
Conclusion
Poor website performance can have disastrous consequences. That’s why it’s important to have a complete view of your infrastructure, your applications, and your services. Using Pingdom, AppOptics, and Loggly allows you to dig deep into the cause and impact of errors and performance problems, helping you quickly get up and running again.
Want to dig deeper? Explore the latest insights from the Gartner® Magic Quadrant™ for Observability Platforms by clicking here.


