Synthetic Monitoring

Simulate visitor interaction with your site to monitor the end user experience.

View Product Info

FEATURES

Simulate visitor interaction

Identify bottlenecks and speed up your website.

Learn More

Real User Monitoring

Enhance your site performance with data from actual site visitors

View Product Info

FEATURES

Real user insights in real time

Know how your site or web app is performing with real user insights

Learn More

Infrastructure Monitoring Powered by SolarWinds AppOptics

Instant visibility into servers, virtual hosts, and containerized environments

View Infrastructure Monitoring Info
Comprehensive set of turnkey infrastructure integrations

Including dozens of AWS and Azure services, container orchestrations like Docker and Kubernetes, and more 

Learn More

Application Performance Monitoring Powered by SolarWinds AppOptics

Comprehensive, full-stack visibility, and troubleshooting

View Application Performance Monitoring Info
Complete visibility into application issues

Pinpoint the root cause down to a poor-performing line of code

Learn More

Log Management and Analytics Powered by SolarWinds Loggly

Integrated, cost-effective, hosted, and scalable full-stack, multi-source log management

 View Log Management and Analytics Info
Collect, search, and analyze log data

Quickly jump into the relevant logs to accelerate troubleshooting

Learn More

Synthetic Monitoring

Simulate visitor interaction with your website, so you and your team are the first to know if your website is slow, broken, or unavailable. Get fast and accurate outside-in monitoring 24/7.

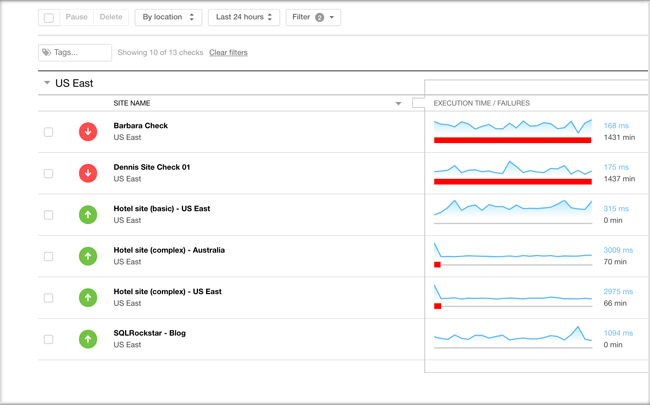
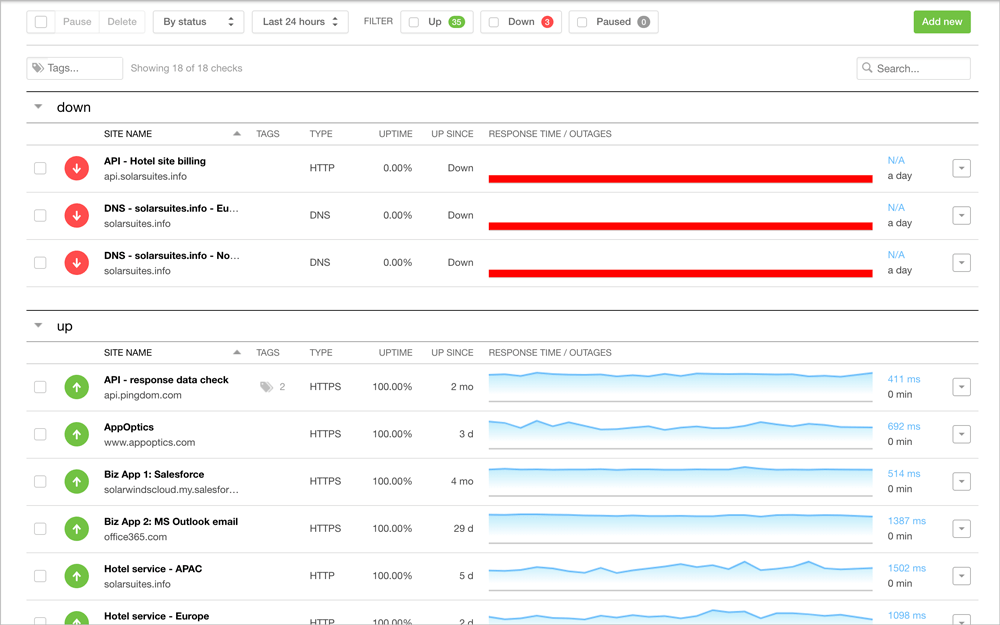
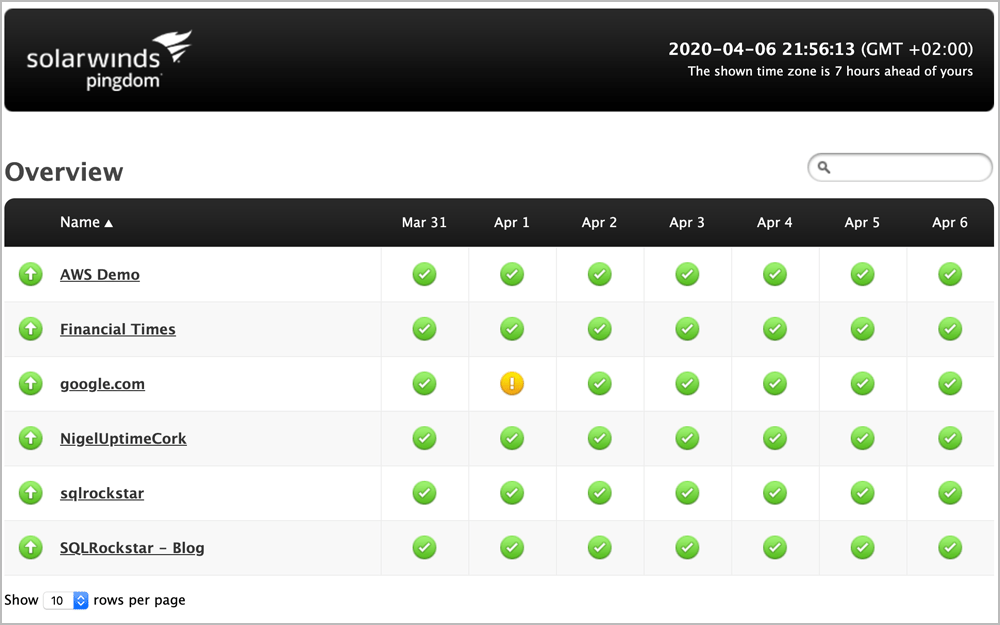
  • Test your website’s availability from all over the world
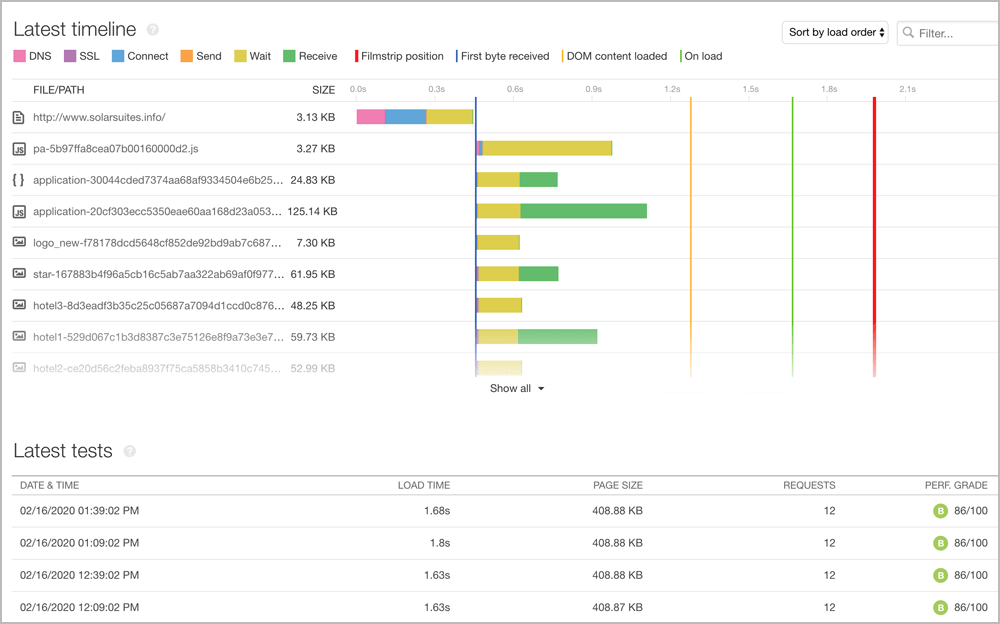
  • Examine and optimize the load performance of critical webpages
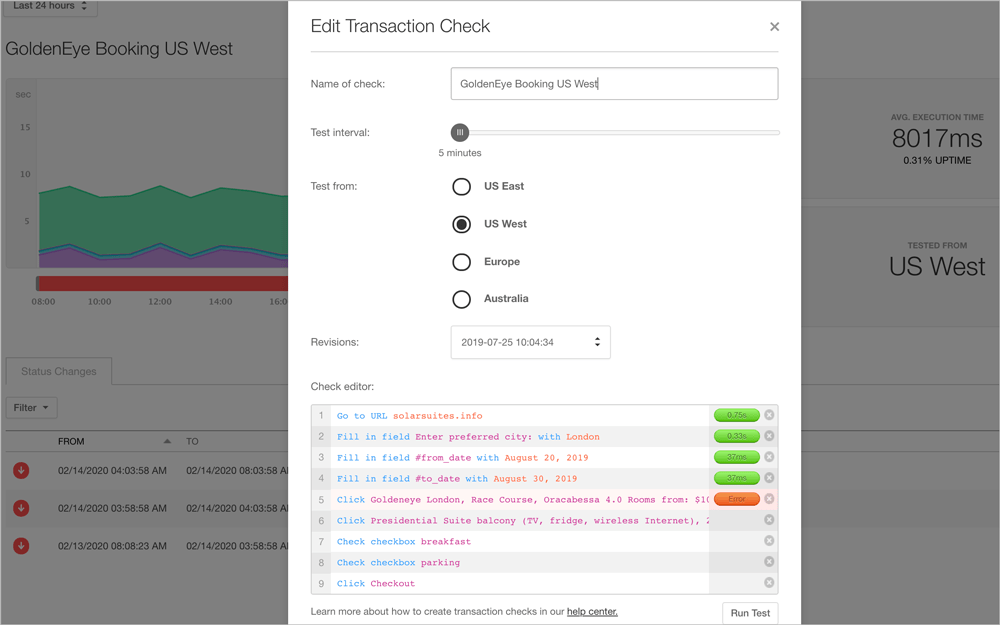
  • Help ensure vital site flows are working as expected
  • Receive alerts via email or SMS when your website is unavailable, or a transaction fails
  • Integrate with your favorite apps like Slack, OpsGenie, PagerDuty, and more
Starts at $10 per month | Calculate Your Price
START FREE TRIAL

First 30 days free
Trial includes Synthetics & RUM

Get Started Quickly and Easily

SolarWinds® Pingdom® Synthetic Monitoring is easy to use, and setting up a check only takes a few steps. Set up page speed, uptime, and transaction checks quickly, so you can start monitoring your website performance today.

Help Ensure a Seamless End User Experience

By constantly simulating visitor interaction with your website, you immediately get alerted when your website is unavailable, slow, or a critical site flow is broken.

Monitor Webpage Load Times

An important factor in keeping first-time visitors on your website is page load speed. Identify if the user’s device, network, or browser is at fault, or if your back end needs to be optimized.

Developer-Friendly API

Leverage performance insights generated by Pingdom synthetic monitoring within your existing systems or portals with the Pingdom API. Create new API queries in minutes with our simplified implementation.

Know the Moment Your Website Becomes Unavailable

Knowing when your site is unavailable is critical to any business. If your website is down, it hurts your brand, disappoints customers, and negatively impacts revenue. Whether you’re out of the office or on the go, monitor your site’s availability from over 100 locations worldwide. Get notified via email or SMS the instant your website goes down, whatever the time of day. Select how you get alerted based on the severity of the incident and choose how quickly you are alerted. You can have alerts resent for ongoing issues up to four times after the initial alert and have peace of mind with a confirmation of resolution after any outage has been handled. When an error is spotted, we double-check it before alerting you and your team.
Learn More

Optimize the User Experience With Faster Load Times

Easily identify and fix bottlenecks affecting load times. The granular webpage load test tools allow you to monitor the performance of every page element. Timeline metrics accurately identify which aspects of your website are hurting web performance, so you can adjust the page elements’ loading order to decrease time to title and render. It also tracks page speed history, so you can see if the changes you made improved performance or not. With page speed monitoring, knowing when and why your website is slow helps you troubleshoot faster and provide an uninterrupted experience for customers.
Learn More

Fix Critical Site Flow Issues Before They Affect Your Business

If transactions like login, search, or checkout are broken, you can be notified before it affects your customers with transaction monitoring. Transaction monitoring simulates visitor interaction with your site automatically and will alert you when your critical site flows stop working correctly. Monitor both simple or highly complex transactions, such as new user registrations, user login, search, shopping cart checkout, URL hijacking, and more. Test from probe servers across the globe as often as every five minutes to once per day.
Learn More

Leverage Performance Insights With the Pingdom API

Automate your interaction with the Pingdom synthetic monitoring system and our API. Create your own scripts or applications with most of the functionality you can find inside the Pingdom control panel. The Pingdom API is RESTful and HTTP-based. This means communication is made through normal HTTP requests. With CRUD endpoints, you can automate the creation of uptime and transaction checks at scale and in dynamic environments, which simplifies larger deployments. Mass-produce and mass-tag transaction checks at scale. Create new API queries in minutes with our simplified implementation.
Learn More

Monitor and Share Performance Against Service Level Objectives

Provide third-party proof to your customers that you’re achieving your SLAs. Pingdom public status pages let you share uptime to your customers or colleagues. They’re easy to use and setup is quick. They’re customizable, so you can easily configure the pages to suit your own brand and only display relevant checks. You can choose between just showing the current status or include historical data if you want to brag about your excellent uptime.

Start Monitoring Free for 30 Days.

Complete monitoring combines real user monitoring and synthetic monitoring for ultimate visibility and enhanced troubleshooting. Start monitoring and get your first 30 days free.

Start monitoring for free