


Last updated: February 29, 2024
Average size of a webpage matters because it correlates with how fast users get to your content. People today have grown to expect good performance from the web. If your website takes more than 2.5 seconds to load, your users will probably never return to you again. Further, the more data your webpage needs to download, the longer it will take—particularly on slow mobile connections.
Balancing a rich experience with page performance is a difficult tradeoff for many publishers. We gathered statistics from the top 1000 websites worldwide to see how large their pages are. We’ll look at what’s driving this change and how you can track the size of your own company’s site.

Recent trends
According to the HTTP Archive, the current average page size of top sites worldwide is around 2484 KB, which has steadily increased over the years. This is based on measuring transferSize, which is the weight of the payload of HTML, as well as all of its linked resources (favicon, CSS files, images), once fully loaded (i.e. at the window.onload event).
Graph of mean Kilobyte totals (April 2018 to July 2023) by The HTTP Archive
With broadband speeds increasing yearly, publishers have added richer content to their webpages. This includes larger media such as images and video. It also includes increasingly sophisticated JavaScript behavior using frameworks like React and Angular.
Additionally, the complete access-speed equation should also consider the average Internet speed in your server and user countries. Today, no matter where your user is in the world, keeping all your webpage sizes under the global average would seem more of a necessity than just a good practice.
Average Internet Speeds [Mbps] by Country in 2023 by Fastmetrics. © 2023 Fastmetrics, Inc. All rights reserved.
Top 10 websites
Here are the top 10 websites that are most commonly visited in 2023 globally:
- google.com
- youtube.com
- facebook.com
- twitter.com
- wikipedia.org
- instagram.com
- reddit.com
- asuracans.com
- tiktok.com
- fandom.com
Imagine what these websites have to do in terms of load time, page speed and file size to ensure they remain at the top.
Actual webpage size
With Google Chrome, it’s possible to manually check a webpage’s size transferred over the network when you load it. First, on the website whose page size you want to check, open the DevTools Network tab, and re-load the webpage.
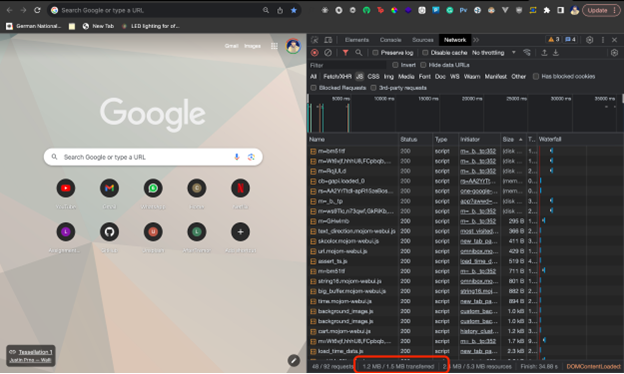
Chrome DevTools
On the bottom right corner of the DevTools panel, you’ll see the amount of data transferred. This is actual file size of the webpage that’s transferred to your browser via your network.
In order to perform this same task in an automatic way for 1000 sites, we wrote a Python scraper program (code on GitHub) that uses Selenium and Headless Chrome to calculate the actual total webpage sizes (including dynamic content loaded by JavaScript before the user starts interacting).
Headless Chromium is a feature of Google’s browser starting on version 59. To use it, the chrome executable runs from command line with the –headless option. We operate it programmatically with a special WebDriver for Selenium (Python-flavored in our case). We also use the Chrome DevTools Protocol to access the Network.loadingFinished events using the RemoteWebDriver. For this, ChromeDriver is running standalone, which by default listens on a remote debugging port 9515 on the local network, available for us to connect using Selenium. Additionally, performance logging is enabled in our code.
All this has been provided in our sample code at github.com/jorgeorpinel/site-page-size-scraper.
Context and limitations
Some of the 1000 websites may be skipped by our tool, given the following rules:
- 10-second total page loading timeout;
- 10-second script execution timeout;
- Ignored when the response is empty;
- Scraper tool ran from the USA. (Some websites are not available or present different content when loaded from different locations.)
Note: Some top webpages from other countries e.g. China didn’t load in the USA or redirect to global content landing pages. The correct way to measure them would be to load each from inside their country but that goes beyond the scope of this article.
Gathering the statistics
We ran the tool providing a list of websites as its only argument:
$ ./from_list.py 2023-10-04-alexa-topsites-1000.txt

Loaded list of 1000 URLs:
 Loading http://google.com... loadingFinished: 395332B, 1.96s
 Loading http://youtube.com... loadingFinished: 1874222B, 3.16s
 Loading http://facebook.com... loadingFinished: 1387049B, 1.21s
 …
 The average webpage size is 2.07MB from 892 processed websites...
You can run the above script for yourself and then compare the results to manually loading those web pages with the DevTools.
Optimize Large Websites
A significant portion of your website’s audience, over one-third to be precise, will disengage if they encounter prolonged loading times for various elements such as icons, images, videos, GIFs, and other multimedia assets. Furthermore, nearly half of your visitors anticipate swift website interactions, expecting everything to unfold within a mere two seconds. This poses a substantial challenge, particularly when dealing with intricate animations, extensive JavaScript packages, and hefty media files. Therefore, it becomes imperative to employ strategies that optimize your website’s production bundle, making it as compact as possible for efficient data transmission.
To delve deeper into this issue, let’s consider the user experience aspect. On average, users allocate approximately 5.94 seconds to scrutinize a website’s primary image. During this brief window, it is crucial to make a lasting impression. To achieve this, a careful selection of images that are not only relevant but also captivating is essential. It’s equally important to steer clear of distracting image sliders, as research suggests that users predominantly focus on the initial image in a slider, rendering subsequent slides largely unnoticed.
Checking total size of your webpage with SolarWinds Pingdom
A quick and easy way to check your total page size is using the SolarWinds® Pingdom® Website Speed Test. This free tool also uses real web browsers in dedicated servers distributed in different global locations to load and analyze website performance. It also adds significant insight into the composition of different aspects of a website’s performance.
Basic performance analysis of google.com via Pingdom.
The SolarWinds Pingdom online tool also separates page size by content type (images, scripts, etc.) and by domain (to differentiate resources coming from the same website, CDNs, third parties, etc).
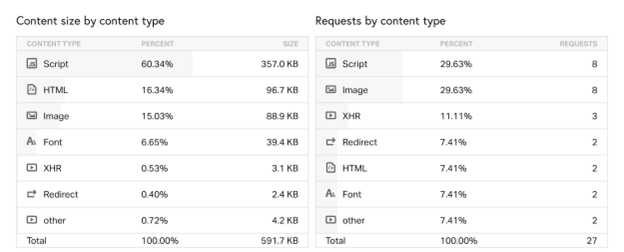
Content size and Requests by content type
SolarWinds is an easy-to-use website performance and availability monitoring service that helps keep your websites fast and reliable. Signing up is free and registered users can enjoy a myriad of tools such as page speed monitoring, real user tracking, root cause analysis, website uptime monitoring, nice looking pre-configured reports, and a full REST API.Pingdom is an easy-to-use website performance and availability monitoring service that helps keep your websites fast and reliable. Signing up is free and registered users can enjoy a myriad of tools such as page speed monitoring, real user tracking, root cause analysis, website uptime monitoring, nice looking pre-configured reports, and a full REST API.
To mention just one great feature among all of the SolarWinds Pingdom solution’s offerings, Real User Monitoring (RUM) is leveraged automatically to create greater insight on the regional performance of your website. Now you can get insight into how real users experience the performance of your site around the world.
Experience Monitoring / Visitor Insights (RUM) map in Pingdom.
Conclusion
You already know your audience. Knowing your website’s page sizes will allow you to better control the performance and availability of your content and applications. Everyone loves a fast website!
Sign up for a free trial of SolarWinds Pingdom to monitor your users’ digital experience, such as uptime monitoring, visitor insights, page speed monitoring, and immediate alerts.
Want to dig deeper? Explore the latest insights from the Gartner® Magic Quadrant™ for Observability Platforms by clicking here.
The SolarWinds trademarks, service marks, and logos are the exclusive property of SolarWinds Worldwide, LLC or its affiliates. All other trademarks are the property of their respective owners.


