Synthetic Monitoring

Simulate visitor interaction with your site to monitor the end user experience.

View Product Info

FEATURES

Simulate visitor interaction

Identify bottlenecks and speed up your website.

Learn More

Real User Monitoring

Enhance your site performance with data from actual site visitors

View Product Info

FEATURES

Real user insights in real time

Know how your site or web app is performing with real user insights

Learn More

Infrastructure Monitoring Powered by SolarWinds AppOptics

Instant visibility into servers, virtual hosts, and containerized environments

View Infrastructure Monitoring Info
Comprehensive set of turnkey infrastructure integrations

Including dozens of AWS and Azure services, container orchestrations like Docker and Kubernetes, and more 

Learn More

Application Performance Monitoring Powered by SolarWinds AppOptics

Comprehensive, full-stack visibility, and troubleshooting

View Application Performance Monitoring Info
Complete visibility into application issues

Pinpoint the root cause down to a poor-performing line of code

Learn More

Log Management and Analytics Powered by SolarWinds Loggly

Integrated, cost-effective, hosted, and scalable full-stack, multi-source log management

 View Log Management and Analytics Info
Collect, search, and analyze log data

Quickly jump into the relevant logs to accelerate troubleshooting

Learn More

Synthetic and RUM – Better together

Cost-effective and holistic

Real User Monitoring (RUM) and Synthetic Monitoring are the two predominant end-user monitoring techniques. Leveraging one with the other allows for a more accurate and comprehensive monitoring experience. Here, we’ll show you how incredibly complimentary they are.

Spalter

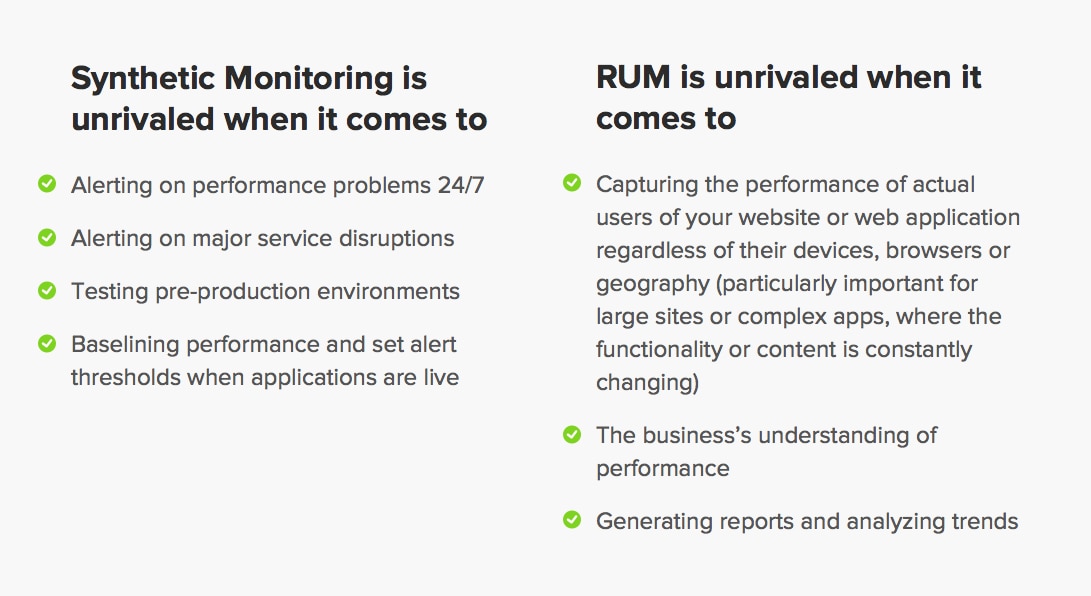
Synthetically generated traffic means a remote and global infrastructure that visits a website periodically and records the performance data for each run. It doesn’t require any installation or code injection on your website to start. If an issue arises, synthetic monitoring provides the insight you need to quickly identify, isolate and resolve problems before they affect users and negatively impact revenue and brand equity.

The primary problem with synthetic monitoring is scaling the scope. For it to be truly valuable you must understand and monitor all high trafficked or mission critical websites and services so a synthetic-only approach is not without its flaws. As its name would suggest, synthetic monitoring does not measure the experience of actual users. Consequently, you will have visibility into the performance of specific pages but left in the dark to performance issues present in other areas.

When people and bots come together.

However, with RUM, a javascript is injected on each page and reports on the page load data for every request that is made for each page. There’s no need to pre-define your important use cases. As visitors goes through the application, all of the performance timings are captured, so no matter what pages they see, performance data will be available for you. Knowing your user trends, such as geographic or channel distribution, helps you better define your business plan and, from a monitoring perspective, allows you to identify key areas on your site that require the most attention.

Synthetic monitoring helps you diagnose and solve shorter-term performance problems. RUM helps you understand long-term trends and synthetic monitoring test results.

Steve Sauders compares RUM and Synthetic page load times here.

Best practice

Synthetic monitoring allows for you to block out much of the noise that is reported with RUM. Use it to identify latency and downtime promptly and scientifically isolate and diagnose the root cause of erratic performance issues. And use RUM to identify target areas for optimization and then create synthetic tests to monitor these pages from relevant geographic areas and channels moving forward. We’ve written about this in an older post.

With this practice, you ensure full visibility of application usage and performance and understand network or channel distribution and flow of your users. Good luck! And remember what Jack Johnson sings in this song.

Connect the best of two worlds. Photo by By Anders Jildén.
SolarWinds Observability now offers synthetic transaction monitoring

Powerful transaction monitoring now complements the availability and real user [...]

Exit Rate vs Bounce Rate – Which One You Should Improve and Why

Tracking your website’s exit and bounce rates will give you insight into how [...]

Introduction to Observability

These days, systems and applications evolve at a rapid pace. This makes analyzi [...]

Webpages Are Getting Larger Every Year, and Here’s Why it Matters

Last updated: February 29, 2024 Average size of a webpage matters because it [...]

A Beginner’s Guide to Using CDNs

Last updated: February 28, 2024 Websites have become larger and more complex [...]

Monitor your website’s uptime and performance

With Pingdom's website monitoring you are always the first to know when your site is in trouble, and as a result you are making the Internet faster and more reliable. Nice, huh?

START YOUR FREE 30-DAY TRIAL

MONITOR YOUR WEB APPLICATION PERFORMANCE

Gain availability and performance insights with Pingdom – a comprehensive web application performance and digital experience monitoring tool.

START YOUR FREE 30-DAY TRIAL
Start monitoring for free