It’s now about a month since we launched the beta of our Real User Monitoring (RUM) service. The response has been great, and we’d like to say a big thank you to everyone who has signed up for the beta and given us feedback.
That feedback we’ve taken to heart and incorporated as much as possible into the final release. As the launch of our RUM service is drawing closer, we wanted to address some questions regarding how it compares to the synthetic monitoring we already offer.
Be the first to know if your site is down
Before we get to talking about Real User Monitoring, let’s spend just a few minutes on synthetic website monitoring, which is the type of monitoring we at Pingdom already offer.
In essence, with our synthetic monitoring, also know as active monitoring, a customer creates a check that specifies:
- What URL (a site or server) they want to monitor.
- What type of check they want to create (HTTP, Ping, SMTP, etc).
- How often it should check the URL.
- Who should be alerted if something is not working.
- And how they should be alerted.
The check then runs on the set schedule, connecting from a server in one of our 40+ worldwide locations. If the server cannot connect, for whatever reason, a second server will be tasked to perform the same test. If the second server also fails, then an alert is issued.
This type of website monitoring is called synthetic because it doesn’t involve real web users, and it’s called active because our servers continuously try to connect, whether the target site is seeing real users connecting or not. Basically, it will only give you answers to questions you already know, like is your site up or not.

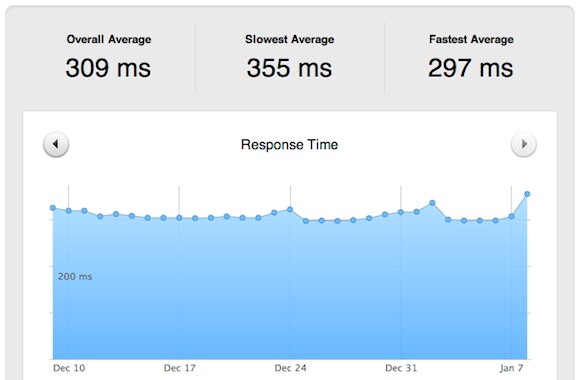
This is how a website’s performance is measured by synthetic monitoring, which only loads the HTML part of the page.
In summary, a synthetic monitoring solution is particularly good at alerting you when your site cannot be reached, meaning you know before the visitors to your site when something is not working. If our system detects downtime, you can, using various tools, analyze what went wrong, and get the site up and running again as quickly as possible.
Synthetic monitoring is not as good as measuring your website’s performance. It can, at best, give an indication of the site’s performance because there are so many variables that affect how it loads for real users.
How real users experience your site’s performance
While a synthetic monitoring solution connects from a server sitting in a data center, with RUM you get data on real users when they browse to your site. Therefore, it’s also referred to as passive monitoring.
With RUM, you specify what site you want to monitor, and place a small code snippet in the HTML of the web pages on that site. It’s all a very quick and easy process and, as soon as that is done, we’ll start collecting RUM data about your site. And that data is collected from each and every page on the site; with synthetic monitoring you only collect data from the specific URL you create a check for.
As good as synthetic monitoring is there are things that it will not be able to tell you, and that’s why you should also employ Real User Monitoring to keep an eye on your website. Not only does RUM give you a much more detailed view of the performance of your site, it also shows you how real users experience your site, at the moment they connect to it. This can involve what kind of connections, browsers, and devices your visitors are using, their geographic location, and more. And you see aggregated data based on each and every user that visits your site, not a limited sample of the data.
In other words, synthetic monitoring can give you an idea of what visitors to your site might experience, but with RUM you can see what actually happened.

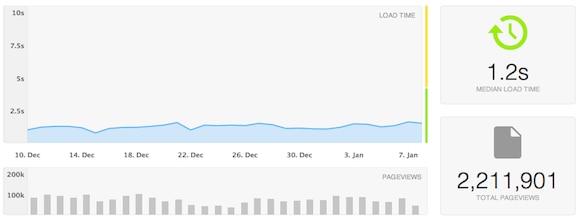
This is just one example of the many ways that our RUM service displays the performance of a website, including how many pageviews it is based on. With RUM, the complete web pages (HTML, CSS, scripts, images, etc.) are loaded, not just the HTML. This gives you much richer information about the performance of the site as well as how your users experience it.
Here is some of what you will be able to learn about your site once you enable Pingdom’s Real User Monitoring check:
- Real-time visits: You can see individual page loads as they happen.
- Performance trends: You can see changes in load time as they happened over time. You simply select a time-range to dig into that period.
- Geographical performance: How do visitors in different countries experience your site? It may be that you concentrate on one or a few countries and want to make sure users there have especially fast experiences.
- Mobile vs. desktop: You can see what percentage of visitors connect with mobile versus desktop, and how each group experiences your site.
- Browser: Of course you want to see what browsers your visitors use, and how the speed varies between browsers.
- The long tail of performance: You can see not only what the fastest load times are, but also the long tail of visitors with slower performance.
- Loading state: This details how long pages take to load and where the time is spent, from the moment the user clicks until the page has completed loading.
- Are visitors happy or frustrated? Specify what performance levels are considered satisfactory, tolerated and frustrating for users. This lets you quickly see their overall level of satisfaction.
Armed with the knowledge you can get from your RUM data, you can, get a good indication of where to start looking in order to fix a problem with the performance of your website. In such a scenario, RUM can be used as a precursor to synthetic monitoring, pinpointing areas that should be investigated further.
To summarize, Real User Monitoring is the best way to measure web performance, and synthetic monitoring is most appropriate for knowing whether a site is up or down. Add to that our Transaction Monitoring, which can help you make sure a multi-step function is working as it should. Using the three together, means you are well prepared to deliver a great experience to the visitors to your website.
Sign up for the beta
That’s a wrap for this time concerning Real User Monitoring. We will be back soon again with a more detailed look at what it can offer you in terms of better understanding how real users experience your website. Then we will dig down into the details of what you can learn from running RUM.
In the meantime, if you have not already, there’s still time to sign up for the beta program. It’s in very active development, and we take all your feedback into consideration as we iterate our Real User Monitoring offering into a shipping product.


