Synthetic Monitoring

Simulate visitor interaction with your site to monitor the end user experience.

View Product Info

FEATURES

Simulate visitor interaction

Identify bottlenecks and speed up your website.

Learn More

Real User Monitoring

Enhance your site performance with data from actual site visitors

View Product Info

FEATURES

Real user insights in real time

Know how your site or web app is performing with real user insights

Learn More

Infrastructure Monitoring Powered by SolarWinds AppOptics

Instant visibility into servers, virtual hosts, and containerized environments

View Infrastructure Monitoring Info
Comprehensive set of turnkey infrastructure integrations

Including dozens of AWS and Azure services, container orchestrations like Docker and Kubernetes, and more 

Learn More

Application Performance Monitoring Powered by SolarWinds AppOptics

Comprehensive, full-stack visibility, and troubleshooting

View Application Performance Monitoring Info
Complete visibility into application issues

Pinpoint the root cause down to a poor-performing line of code

Learn More

Log Management and Analytics Powered by SolarWinds Loggly

Integrated, cost-effective, hosted, and scalable full-stack, multi-source log management

 View Log Management and Analytics Info
Collect, search, and analyze log data

Quickly jump into the relevant logs to accelerate troubleshooting

Learn More

New feature: Suggested monitoring

What if you could get a little help finding exactly what you should monitor on your website? A helpful wizard when you’re getting started that, based on a URL you enter, crawl through your website then suggest what to monitor. Font and script libraries, CDN’s, ad-networks, and any other resource that your website depend on to run smoothly. Well, now you can!

We have added a new onboarding service to the Pingdom Pingdom Uptime Monitoring Service, where we help our new customers discover what to monitor. This is just the first phase of this “discovery service” and we will enable it for existing customers shortly. Modern websites have many dependencies to function and continuously provide service to its users.

We believe this will further our customer’s knowledge and provide valuable insights to any and all outages that occur.

It’s never been easier to set up monitoring

Setting up is all done in 3 easy steps.

discovery-1

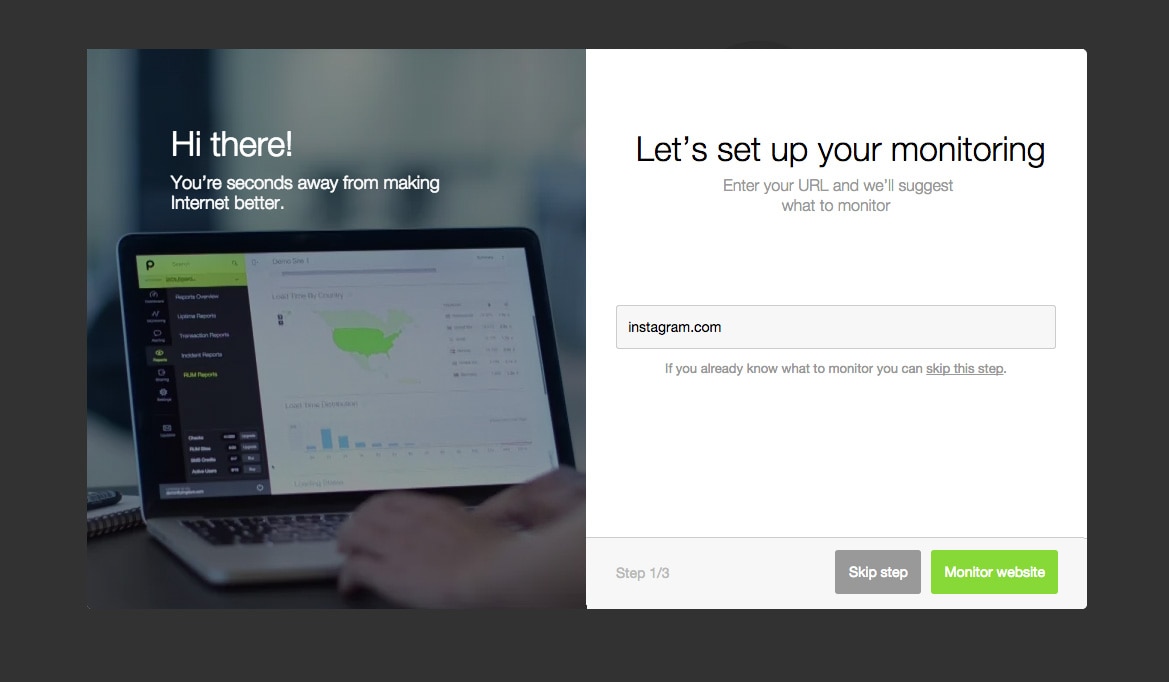
1. Start by entering the URL of the website you wish to monitor.

discovery-3

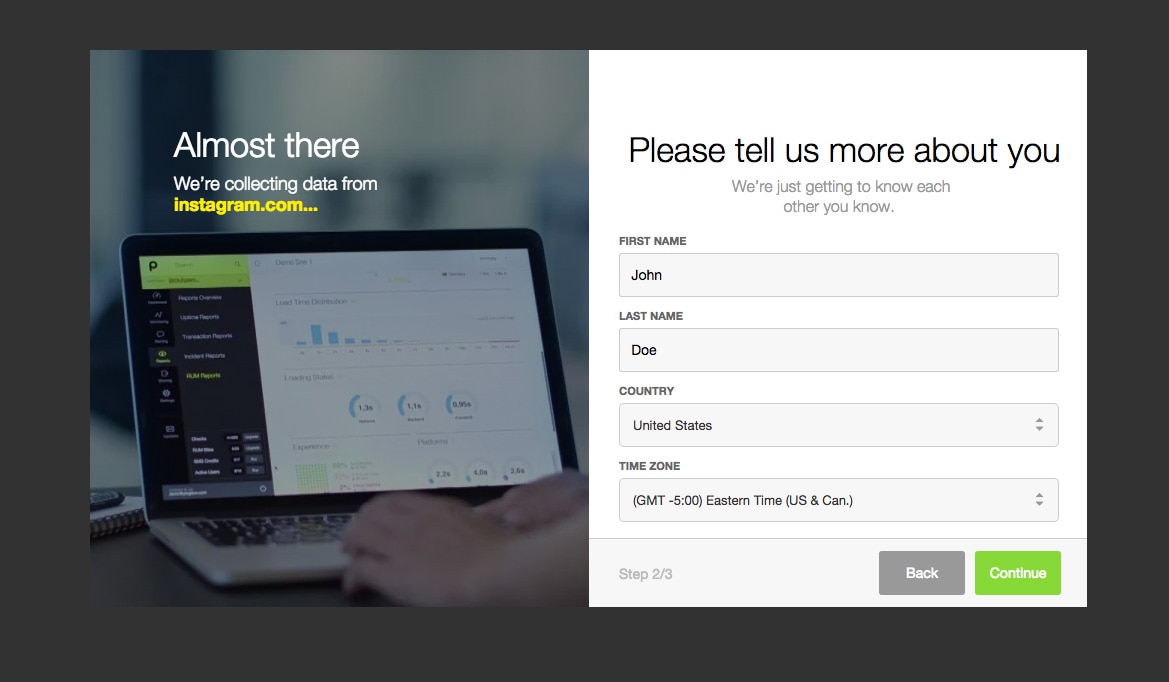
2. Pingdom immediately starts collecting data from the website. Fill out your information (important because of alerting)

discovery-2

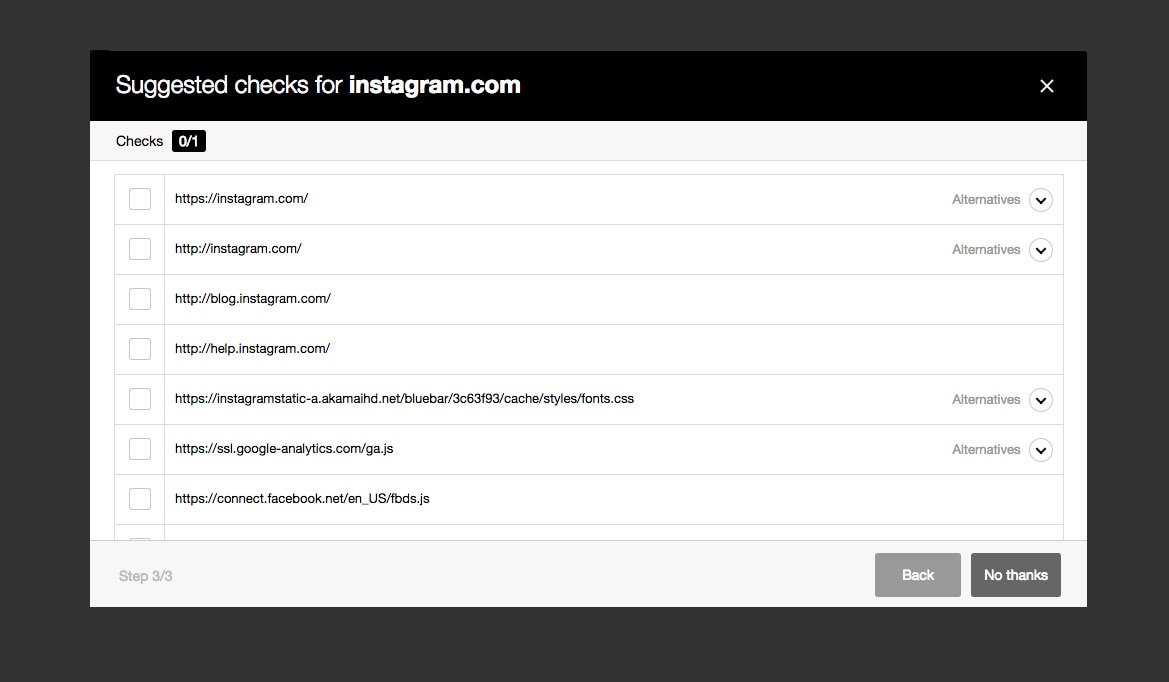
3. Finally choose what you want to monitor from the list returned. That’s it. Yes, you can of course skip this all together and set this up by yourself.

Introduction to Observability

These days, systems and applications evolve at a rapid pace. This makes analyzi [...]

Webpages Are Getting Larger Every Year, and Here’s Why it Matters

Last updated: February 29, 2024 Average size of a webpage matters because it [...]

A Beginner’s Guide to Using CDNs

Last updated: February 28, 2024 Websites have become larger and more complex [...]

The Five Most Common HTTP Errors According to Google

Last updated: February 28, 2024 Sometimes when you try to visit a web page, [...]

Page Load Time vs. Response Time – What Is the Difference?

Last updated: February 28, 2024 Page load time and response time are key met [...]

Monitor your website’s uptime and performance

With Pingdom's website monitoring you are always the first to know when your site is in trouble, and as a result you are making the Internet faster and more reliable. Nice, huh?

START YOUR FREE 30-DAY TRIAL

MONITOR YOUR WEB APPLICATION PERFORMANCE

Gain availability and performance insights with Pingdom – a comprehensive web application performance and digital experience monitoring tool.

START YOUR FREE 30-DAY TRIAL
Start monitoring for free