


Enterprise web applications or medium-to-large, consumer-facing websites are typically built by teams of engineers, administrators, web developers, and other professionals. However, once a site goes live, the operations team is responsible for keeping the site up and running at optimal performance.
Online users aren’t forgiving, often abandoning a site as soon as they encounter an issue with functionality, complexity, or performance. It’s imperative you find issues with your site before your users do.
While site monitoring can be a complex endeavor, the most basic task is simply to monitor what users are experiencing in real time. Since it’s not feasible to ask users for feedback in real time, there needs to be a way to capture information about what they see or experience, and why they drop off at a particular point. This type of user-centric monitoring can:
- Quickly identify page availability, accessibility, and load problems
- Find trending performance bottlenecks
- Check functionality or usage problems
- Identify successful or unsuccessful site features
- Segment user behavior
In this post, we’ll look at how monitoring can help WordPress site administrators identify areas for site optimization.
Different Kinds of Monitoring
Website monitoring can be broken down into three domains: web analytics, real user monitoring, and synthetic monitoring. Note, by website monitoring, we’re talking about a site’s performance from a user’s perspective (rather than the performance or availability of its underlying infrastructure, network, web server, or security).
Web Analytics
The primary goal of web analytics is to track and report basic user behavior as they interact with your site. These reports contain information including:
- Where your site visitors come from
- What devices your visitors use
- Which pages visitors request most
- How long visitors spend on each page
- Whether visitors convert to take actions (like signing up or purchasing products)
Using this data, site owners can profile their target user base or add more functionalities to the site to attract more visitors. Web analytics data is typically used for digital marketing.
Real User Monitoring (RUM)
While there’s some overlap with web analytics tools, real user monitoring (RUM) is concerned with how users interact with a website in real time and whether the application is delivering the intended results. RUM is a passive monitoring technology designed to record and report user interaction statistics. A careful analysis of RUM reports can help organizations spot problems with their web applications and optimize those applications to improve reliability and performance. Like web analytics, RUM tools can also be used by digital marketers, but their main users are operations teams responsible for site reliability engineering (SRE).
Synthetic Monitoring
Synthetic monitoring involves monitoring a web application with data as if a real user were performing step-by-step actions (hence the name “synthetic”). This kind of monitoring can be as simple as a quick confirmation your site is online, or it can involve complex scripts designed to closely mimic user behavior. Failed checks automatically generate alerts, helping operations teams to address issues quickly. SolarWinds® Pingdom® includes a full set of synthetic monitoring tools.
How RUM Works
The actual mechanics of RUM are simple. An application developer takes a small, lightweight JavaScript snippet with a site ID and adds it to the website code. An external application tracks the site’s real user experiences through that ID. The snippet is used to collect detailed data such as:
- Critical page availability
- Page load time
- Geolocation of website visitors
- Browsers and devices used
- Number of return visitors
- Number of page visits by users
- Number of requests per page
For example, your website is running a campaign for a specific geographical region. It makes sense to check the load times for the relevant parts of the site in the region. Using a RUM tool, you can check if the pages load properly in all browsers in the region, or if the web sessions launched from mobile devices are noticeably shorter than those on desktops. Indicators like these can help your developers optimize the site UI for device compatibility. If a shopping cart gets abandoned halfway through a transaction, it might indicate system crashes.
Introducing SolarWinds Pingdom
SolarWinds Pingdomis a SaaS RUM tool with comprehensive capabilities like live geographic mapping, advanced filtering, user behavior metrics, and end-user experience monitoring. Its other features include:
Using these metrics helps you answer various important questions about your website and the need for possible optimization:
- Is your technology stack weighing down your pages and leading to a slow or unpleasant user experience?
- Is your application connecting reliably and efficiently with your back-end resources?
- Is your site designed intuitively enough so your users can easily move between resources?
- Are transactions happening quickly enough, or are there unexplained delays?
- Do any of your pages suffer 4xx or 5xx failures?
Introducing the Pingdom WordPress Plugin
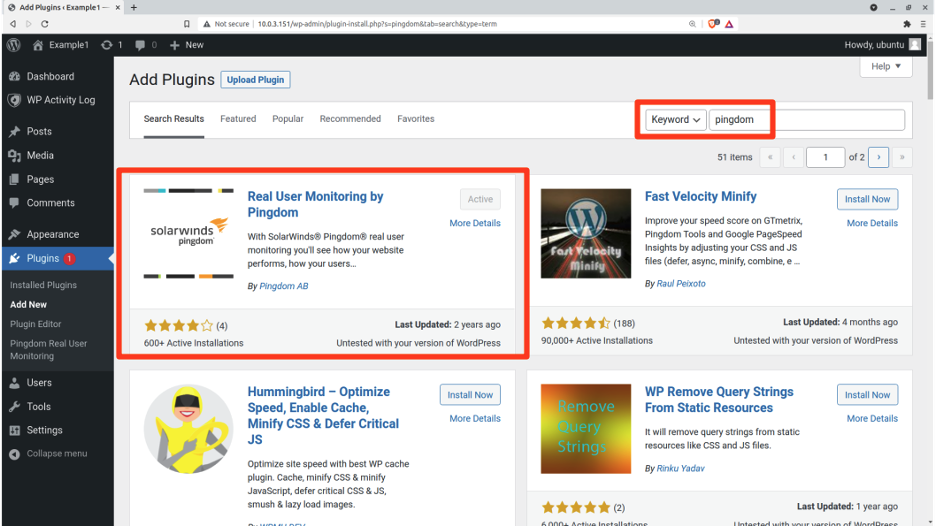
Nearly 40% of the Internet’s websites are built on the WordPress CMS. One of the many advantages of WordPress is its ability to extend the core CMS functionality with a rich ecosystem of plugins. Not surprisingly, WordPress has a plugin for Pingdom. Installing the Pingdom plugin follows the same process as installing any other WordPress plugin.
Add Your Website to Pingdom Real User Monitoring
Before you can configure the Pingdom WP plugin, you’ll need to create a Pingdom account. Create a new site definition from the Real User Monitoring section, and then copy the site ID from the code snippet you’re shown.
From Pingdom’s Real User Monitoring page, clicking the green Add Site button will display the dialog shown below.

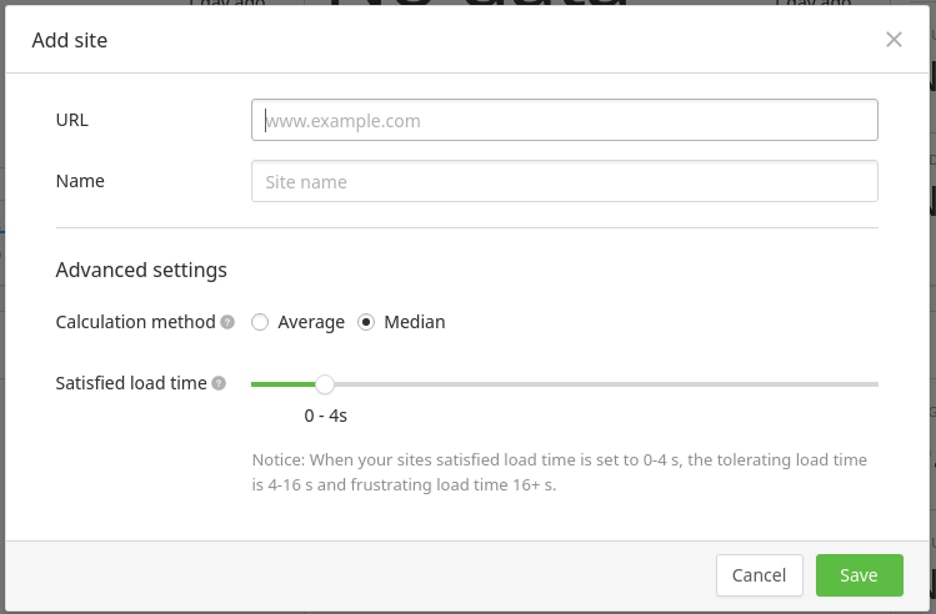
You’ll need to enter the site’s URL and a descriptive name to make the site easily identifiable in the RUM interface.
Pingdom will show a dialog box with a code snippet containing the site’s unique ID. Your site ID is the hexadecimal string that follows pa-. You can copy the site ID from the code snippet.
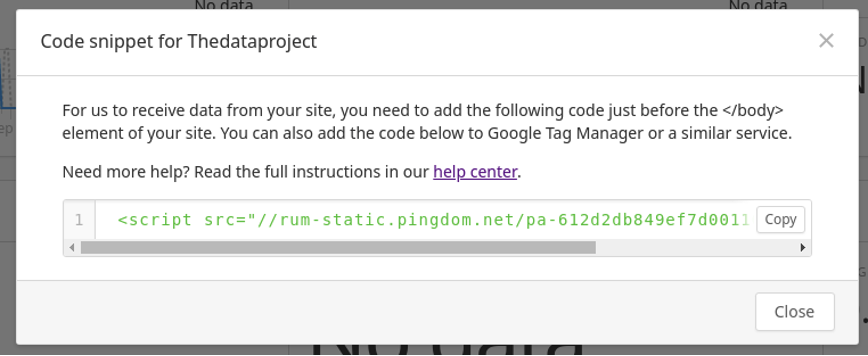
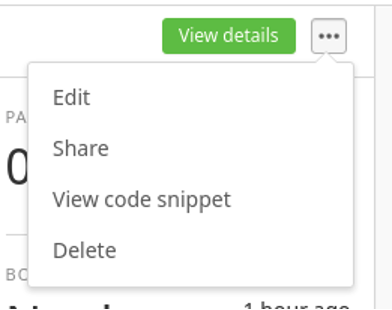
If you forget to copy the snippet, you can still access it by clicking the button to the right of the site’s View details button and then selecting View code snippet from the drop-down menu.
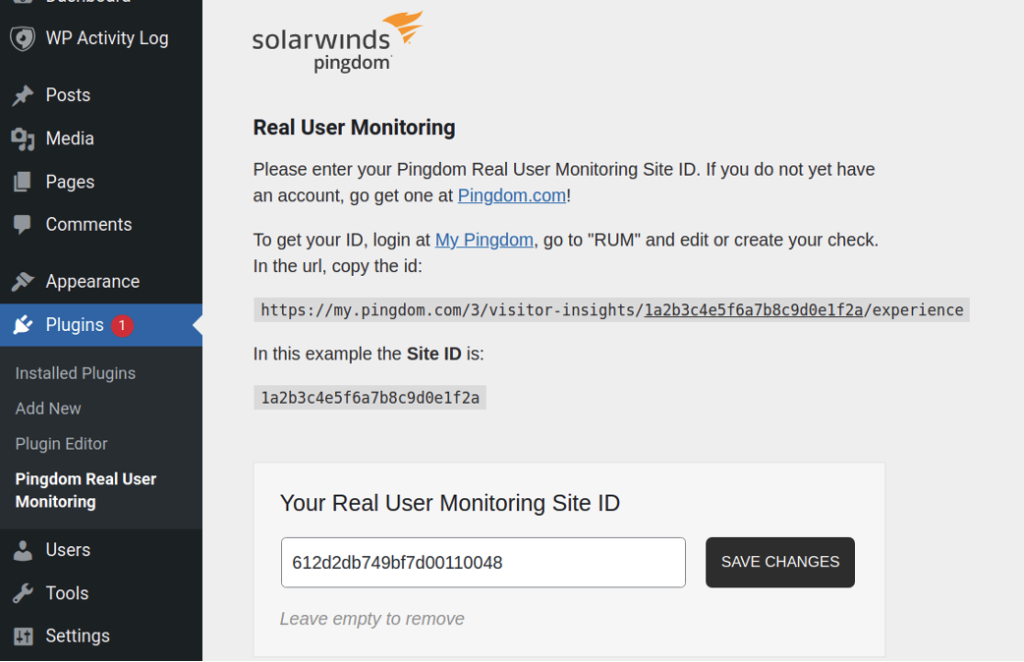
Configuring Pingdom WordPress Plugin
With the plugin installed and the site registered with Pingdom, you can click the Pingdom Real User Monitoring menu item from the WordPress admin site and then enter the site ID. Within a few moments, site usage data should begin appearing on your Pingdom page.
Analyzing Historical Data for Site Optimization
To get a sense of how this would work in real life, let’s take a quick look at some real data reports. From the main RUM interface, click on the green View details button associated with your site to get your site’s core metrics.
At the top of the page, Pingdom shows you some critical figures at a glance:
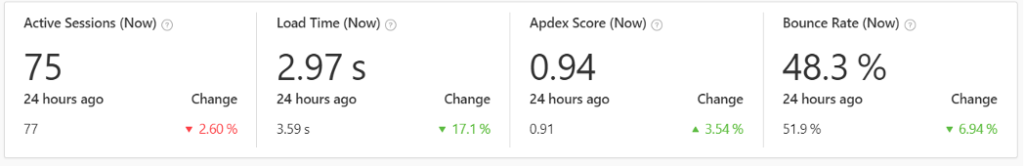
You can easily see if your site’s traffic is heavier than the previous 24 hours, or if its load time has decreased over the last 24 hours.
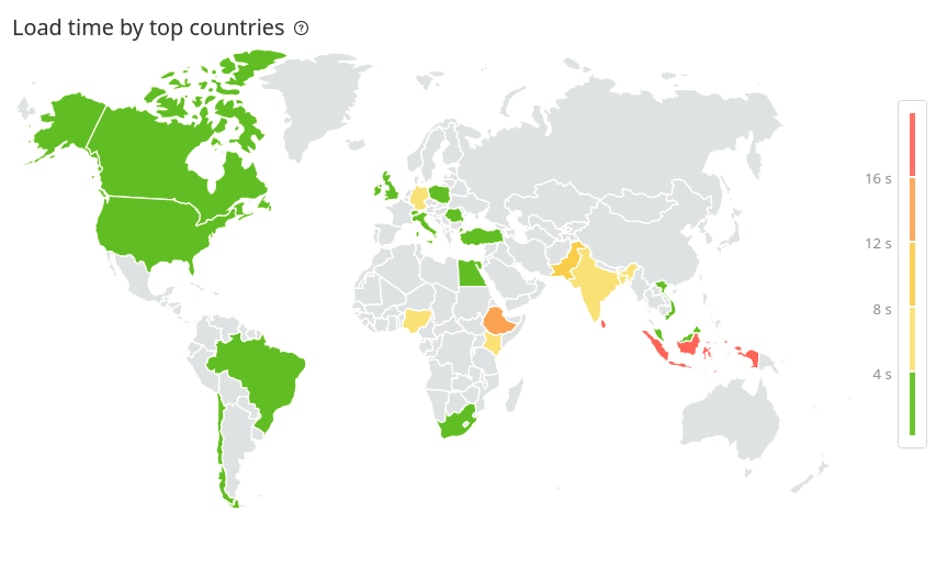
You’re shown a world map to help you visualize load times by geography. In this example, Pingdom shows you page loading in some regions (North and South America, South Africa, and most of Europe) is much faster than in India and the South Pacific region. Since the CDN used by this particular site is set to give preference to those regions, that’s what we would expect.
You can specify a date range to narrow down the results. The drop-down menu at the top-right of the page (shown below) lets you set the date range.

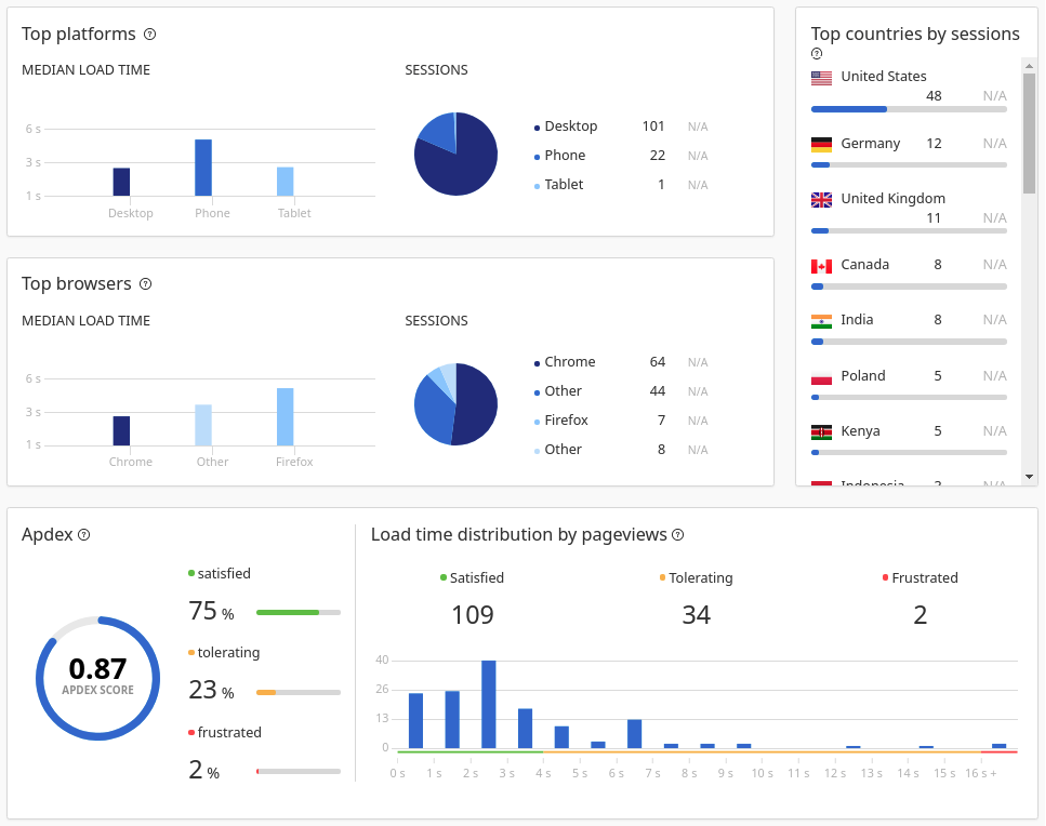
Scrolling down the page will also show you how the site’s pages are performing. The top metric in the next image breaks down page load times by device types. The second graphical widget shows the same metric broken down by browser. The widget at the bottom shows the Apdex.

You can also see statistics about top viewed pages or load time trends.
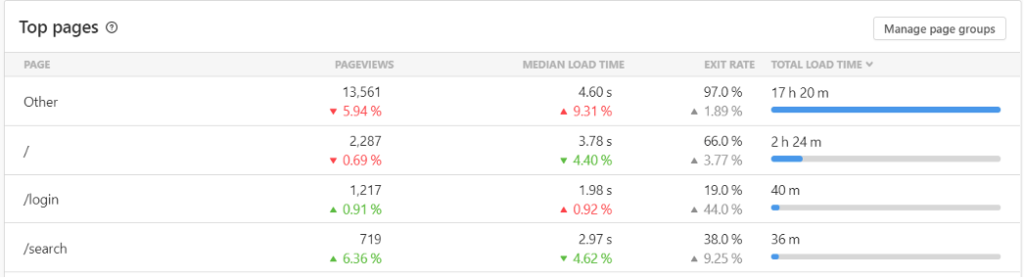
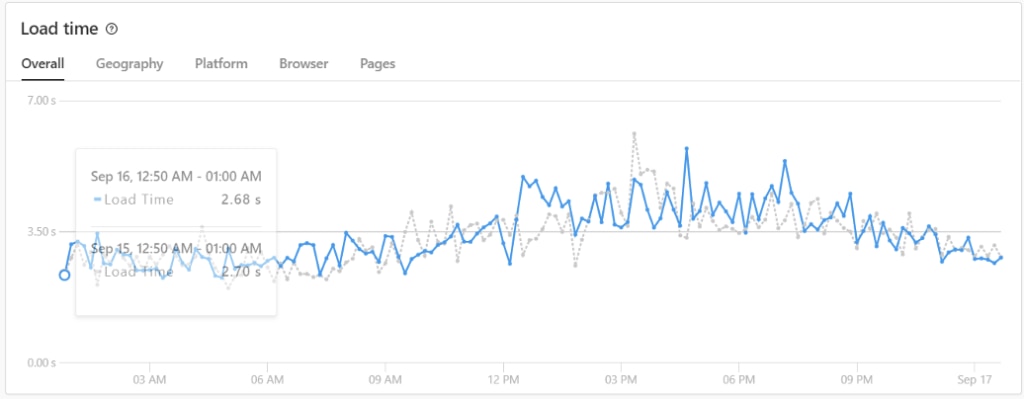
As you can see, the load time can be sliced and diced by geography, platform, browser, or page.
You can control the amount of data displayed by selecting a date range, specific page groups, device category (for example, platform), browser, and country.

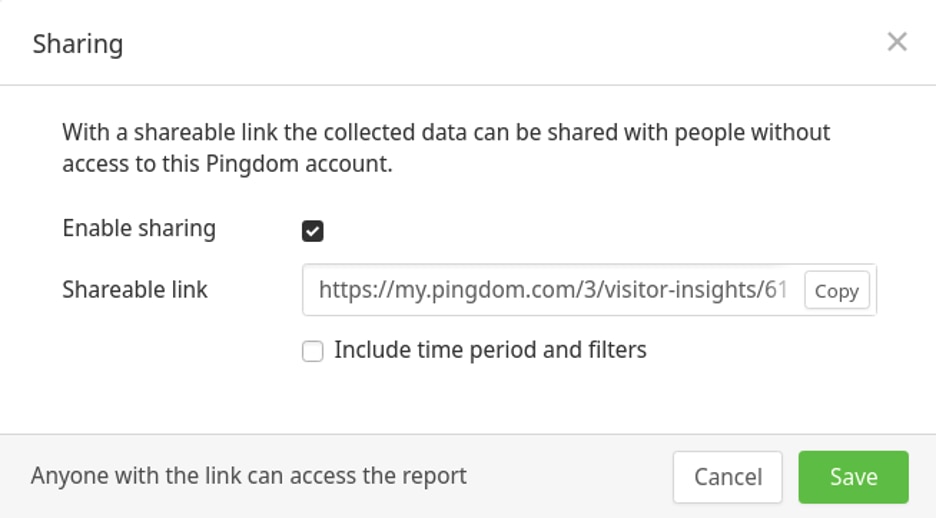
These visualizations can be shared with clients, other team members, or organizational stakeholders—even if the recipients don’t have Pingdom accounts. Clicking the Share button yields a shareable URL.
Conclusion
We’ve seen how Pingdom’s insights can help optimize your WordPress website. Regular attention to these insights can alert you to performance or usability problems. These insights help operations teams dig deeper into the root cause of issues, whether that be new or upgraded plugins, application code changes, web server misconfiguration, or perhaps caching issues at a CDN endpoint.
As a managed, SaaS solution, Pingdom doesn’t put an unnecessary burden on the web server or the network. Also, its worldwide monitoring locations ensure you’re getting a realistic picture of your site’s actual user experience.
Once you’ve created your Pingdom account and used its RUM statistics to optimize your WordPress site, you may want to take it to the next level by using some of its features to reach your target audience more effectively. We’ll cover this in our next blog. Stay tuned!


