Synthetic Monitoring

Simulate visitor interaction with your site to monitor the end user experience.

View Product Info

FEATURES

Simulate visitor interaction

Identify bottlenecks and speed up your website.

Learn More

Real User Monitoring

Enhance your site performance with data from actual site visitors

View Product Info

FEATURES

Real user insights in real time

Know how your site or web app is performing with real user insights

Learn More

Infrastructure Monitoring Powered by SolarWinds AppOptics

Instant visibility into servers, virtual hosts, and containerized environments

View Infrastructure Monitoring Info
Comprehensive set of turnkey infrastructure integrations

Including dozens of AWS and Azure services, container orchestrations like Docker and Kubernetes, and more 

Learn More

Application Performance Monitoring Powered by SolarWinds AppOptics

Comprehensive, full-stack visibility, and troubleshooting

View Application Performance Monitoring Info
Complete visibility into application issues

Pinpoint the root cause down to a poor-performing line of code

Learn More

Log Management and Analytics Powered by SolarWinds Loggly

Integrated, cost-effective, hosted, and scalable full-stack, multi-source log management

 View Log Management and Analytics Info
Collect, search, and analyze log data

Quickly jump into the relevant logs to accelerate troubleshooting

Learn More

Seeing Is Believing with Filmstrip for Page Speed Reports

Sometimes seeing really is believing, and our Page Speed reports are no exception. Earlier this month we release our new Filmstrip feature, which gives you a visual timeline of how your page loads with every test you run.

If you’re wondering how to make the most out of our new feature, we’ll show you how Filmstrip can give you that extra helping hand in understanding the data we present in your Page Speed reports and how to make the most of it when optimizing the performance of your web page:

Understand how critical elements load on your page

Prior to releasing our Filmstrip feature, you could see the order in which every element loaded on your site through our waterfall chart, which still gives you the most granular view of how your page loads. However, quantifying the bars in a waterfall chart to a real life page experience can be difficult. The Filmstrip feature gives you a snapshot of your page from the moment the test is run, and every 500ms thereafter until your page has fully loaded.

This allows you to see a condensed version of how your page loads visually, and whether visitors to your page see what they need as soon as possible, or are left waiting for content and images to load.

Correlate page load milestones to the waterfall chart

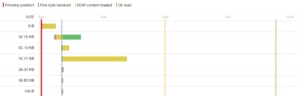
With Filmstrip, it’s now easier to see key milestones in your page’s load within the waterfall chart. You’ll now see that your waterfall chart has three lines through it that highlight:

  1. First byte received, or the time taken from making the HTTP request load the page until the first byte was received, represented by a blue line. This feature is great if you want to check if slow load times are due to server-side issues.
  2. DOM content loaded, or the point at which the initial HTML document has been completely loaded and parsed, without waiting for stylesheets, image and subframes to finish loading. This is represented by a yellow line.
  3. On load, or the green line, showing when all of the page’s resources have finished loading, including images, stylesheets and scripts but excluding any resources initiated to load late, like external ads or images further down the page.
In addition to the load states of each element, the waterfall chart shows you key milestones like First Byte Received, DOM Content Loaded, and On Load.
Webpages Are Getting Larger Every Year, and Here’s Why it Matters

Last updated: February 29, 2024 Average size of a webpage matters because it [...]

A Beginner’s Guide to Using CDNs

Last updated: February 28, 2024 Websites have become larger and more complex [...]

The Five Most Common HTTP Errors According to Google

Last updated: February 28, 2024 Sometimes when you try to visit a web page, [...]

Page Load Time vs. Response Time – What Is the Difference?

Last updated: February 28, 2024 Page load time and response time are key met [...]

Can gzip Compression Really Improve Web Performance?

Last updated: February 26, 2024 The size of the web is slowly growing. Over [...]

Monitor your website’s uptime and performance

With Pingdom's website monitoring you are always the first to know when your site is in trouble, and as a result you are making the Internet faster and more reliable. Nice, huh?

START YOUR FREE 30-DAY TRIAL

MONITOR YOUR WEB APPLICATION PERFORMANCE

Gain availability and performance insights with Pingdom – a comprehensive web application performance and digital experience monitoring tool.

START YOUR FREE 30-DAY TRIAL
Start monitoring for free