


It’s funny how even today, in 2022, people still ask me if WordPress is a good choice for a high-traffic website. There are few website-building solutions on the internet as tested as WordPress. And brands like TechCrunch and The New Yorker wouldn’t be hosted on WordPress if traffic was an issue.
But here’s the thing: WordPress is self-managed. As a result, you as an individual or organization using it for your business are responsible for monitoring your WordPress site. And as it turns out, many people don’t know how to do this properly, which leads to the WordPress slander you tend to find here and there.
But today, we’ll clear up any doubts about WordPress and monitoring as we go through a comprehensive and practical rundown of what it takes to properly monitor a site built with WordPress.
Performance Metrics That Matter
There’s a considerable number of metrics you can monitor on a website. Before we look at the “how-to,” let’s discuss a few. Many website metrics play a key role in understanding the end-user experience or keeping track of Service Level Agreement (SLA) terms.
Application Usage and Traffic
Traffic information can be captured by a handful of metrics. The simplest is the unique visitor count, a metric that tells you the number of new visitors your website has received in a defined period. Generally, this represents the value people get from your website and helps guide marketing endeavors.
Availability (Uptime and Downtime)
Uptime represents the total time your website is online compared to the total time measured, represented as a percentage. Downtime is the inverse, so one of the two is usually sufficient. If you’re using a hosting provider for your site, this is an important metric you want to monitor to ensure the hosting provider’s SLAs are being met. If you’re self-hosting your site, you’ll want to monitor this since you need to be the first person to know when users can’t access your website.
Page Load Time
When a user clicks a link to a webpage, they want all the content on the page to load as quickly as possible. The time it takes for the page contents to load is captured by this metric and is arguably one of the most important website metrics to monitor.
Requests Per Second
This is another metric that captures application usage and traffic. The number of requests your website receives is key because spikes can affect almost all other metrics. As a result, this is a metric you want to stay on top of to catch early indications of problems and to figure out root causes.
Tools to Help You Stay on Top
These metrics are a few essentials to monitor. As you’ll see, the tooling we use to accomplish this allows for plenty more. So, whatever you need to monitor, it’s most likely possible.
Now, let me present the ultimate WordPress monitoring combo: Pingdom + Loggly.
- Pingdom
SolarWinds® Pingdom® is a powerful website performance and end-user experience platform. It carries out application performance monitoring, combining insights from user experience, metrics, traces, and log data. Pingdom offers a WordPress plugin for direct integration with WordPress sites.
- Loggly
SolarWinds® Loggly® offers next-level logging and monitoring by providing advanced log search, filtering, and analysis functionality.
- WP Activity Log
WP Activity Log is a WordPress plugin designed to mirror WordPress logs and forward them to Loggly.
The combination of the Pingdom via a WordPress plugin and Loggly via WP Activity Log provides functionality to cover most WordPress monitoring use cases that I’ve come across. This is why I believe these stand a good chance to work for your website.
Finally, both Pingdom and Loggly are SolarWinds products. This creates some tooling cohesion and a better integration experience.
Integrating Pingdom With WordPress
Pingdom is easy to set up. Follow these simple steps, and you should be up in no time:
- Create an account on the Pingdom platform. (They offer a free 30-day trial.)
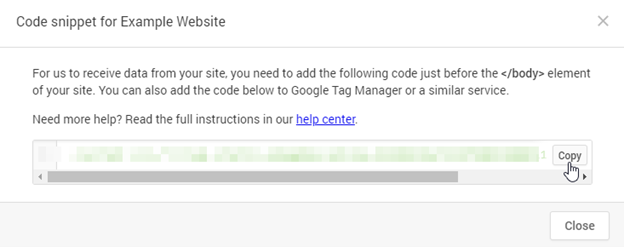
- Generate a key. To do this, click the Real User Monitoring icon in the left menu. Then click the green Add Site button on the right side of the screen. You should see a form show up where you will enter your WordPress site URL and a descriptive name for the site. You can leave the rest of the options with the defaults and click Save. This creates a Pingdom key that’s visible in the generated snippet.
- Now, via your WordPress admin panel, find and install the Real User Monitoring by Pingdom plugin.
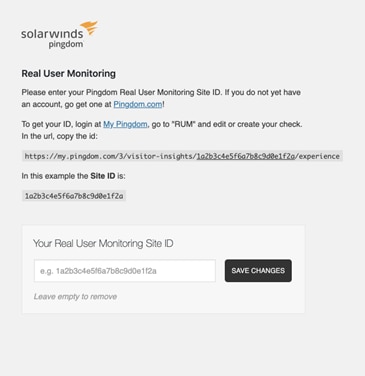
- Configure Pingdom on WordPress with the ID from the Pingdom dashboard.
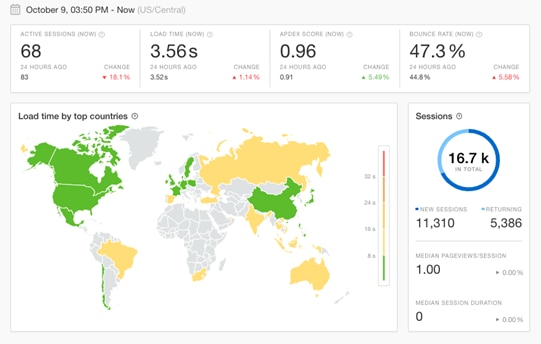
- Once this is complete, Pingdom will begin displaying your WordPress website metrics.
Integrating WP Activity Log
Earlier, I mentioned Loggly uses WP Activity Log to mirror log data from WordPress into Loggly. So, you’ll need to install it before proceeding with Loggly. Ensure the WP Activity Log plugin is installed from the plugin directory. After you’ve installed it, turn it on so you can follow along without any problems.

Using Loggly With WordPress
The Loggly setup process requires configuring both Loggly and the WP Activity Log mirror, so it’s a bit longer for Pingdom. However, if you follow this guided walkthrough, the process is a breeze.
Create a Loggly Account
Create an account on the Loggly platform (they also offer a free trial). Once you’ve set up your Loggly account, you’ll want to sign in and generate a Customer token. You can do this from the Loggly home page by clicking the Logs menu in the sidebar, the Source setup button, and finally selecting the Customer Tokens tab. From there, create a new token by clicking Add New. This generates a token you’ll use later.
Head back to WP Activity Log to integrate it with Loggly. Click Integrations from the WordPress sidebar and then Create a Connection to follow along.
Note: The integration feature is only available in the paid version of the WP Activity Log plugin. However, they do offer a 14-day free trial.
The WP Activity Log plugin makes the integration process easy with a simple, intuitive Connection wizard. Follow the steps below to integrate WordPress and Loggly using the wizard.
Creating a Connection
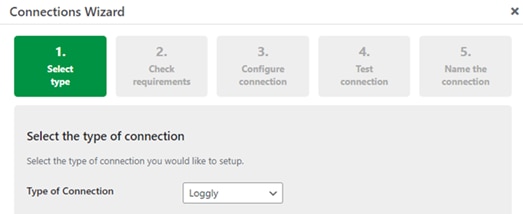
- To connect to your Loggly dashboard, select Loggly from the dropdown menu on the page.
- A verification step examines your WordPress installation to ensure that it passes some basic compatibility tests. When everything seems good, click Next.
- Enter the Loggly customer token you previously generated.
- To ensure your website can interact with Loggly, test your connection.
- Provide a name for this connection.
Setting Up a Mirror
After you’ve created a connection, you’ll need to create a Mirror, which will transfer the event logs collected by WordPress to Loggly. A basic Mirroring wizard is used to do this.
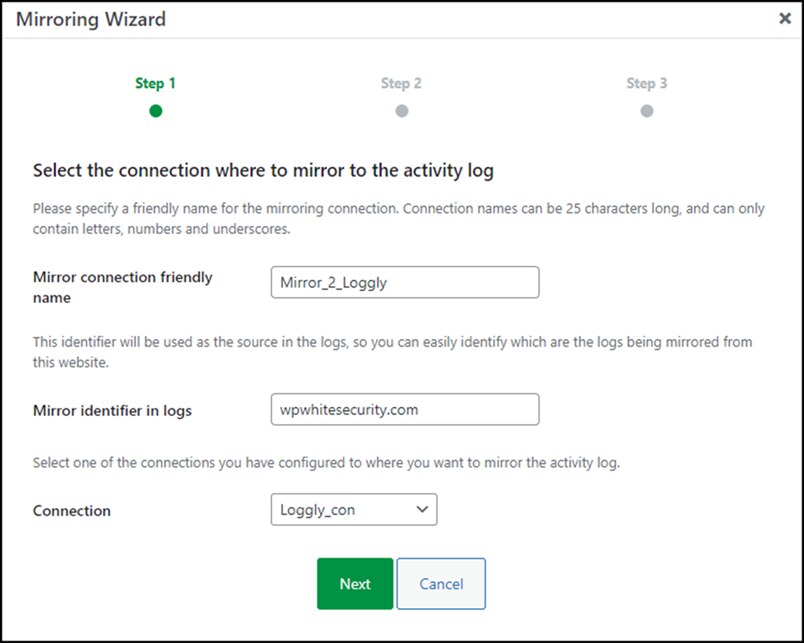
- Create a name, identifier, and connection for your mirror connection.
- Once the configuration is complete, select the Start once configured checkbox to allow log mirroring to Loggly.
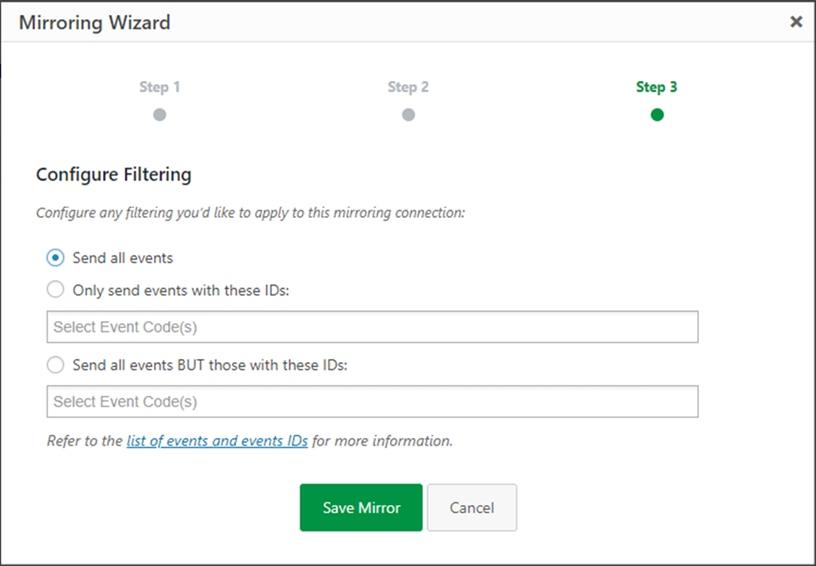
- You can filter which logs are mirrored to Loggly. Feel free to change it up as you see fit.
- Save your mirror settings.
Wait a few minutes after saving your mirror before checking the Loggly dashboard for new logs. You may need to refresh the page. If you don’t see any logs after a while (say, 10 minutes), check your mirror settings to ensure you didn’t inadvertently set a filter.
Congratulations! You have successfully connected your site to Loggly!
Get the Best Out of the WordPress Ecosystem
That was quite a setup, with many things going on. Thanks to Pingdom, Loggly, and WP Activity log for their ease of use, because without it, setting up a robust monitoring solution like this would be no easy feat.
We covered everything it takes to have good monitoring for a WordPress site. Take the time to familiarize yourself with all the features in Pingdom and Loggly, such as interactive dashboards and rules-based alerts. That way, you can take full advantage of the flexibility and options both products offer. When you do this, I have no doubt your website users will be able to get the excellent customer experience they deserve.
This post was written by Boris Bambo. Boris is a data and machine learning engineer fascinated by technology, education, and business. Feel free to connect with him on LinkedIn.


