


Whether it be a European city break, a hike in the mountains or sipping cocktails that come with little umbrellas on an idyllic beach, we all love holidays. That’s why the online travel industry is big business—worth $533.52 billion in 2015—and shows no signs of slowing down.
With thousands of travel companies competing for your holiday dollar, as consumers, we’re pretty much spoiled for choice when it comes to booking a holiday online. In such a cutthroat industry, having a well-performing website is essential to drawing in those potential holidaymakers. That’s why we’ve analysed the web performance of the world’s top 100 travel sites.
To get the broadest picture possible, we’ve included travel agencies, airlines and hotel booking sites on the list—basically all the things you would consider when booking your holiday online.
How we tested the web performance
Our test is based on the 50,000 biggest websites in the world according to Alexa Traffic Rank. We tested each website from the nearest test location to provide the most optimal load time. Web metrics data are collected on the same weeks to minimize temporal fluctuations and maximize comparability. You can view and download the complete list of all the 100 sites here.
For each website, we set up a Pingdom Page Speed Check testing it every 30 minutes for two weeks (February 20 – March 6) to collect data about how fast it loaded, how many requests it used, how big the homepage was, and a lot more. We then calculated the median of more than 600 tests per website. As site availability was another important factor into the performance of the top 100 travel sites, we set up a Pingdom Uptime check to test the availability of each site every minute and again calculated the median uptime of over 20160 checks per website.
Just to be extra diligent in our research, we used Google’s WebPageTest so we could add the experience-focused Speed Index. It measures how quickly the page contents are visually populated (a lower score is better). It’s particularly useful for comparing experiences of pages against each other.
How we measured the results
As we’ve mentioned before, the results gleaned from synthetic, or automatic, testing will never be as accurate or valuable to your business as data collected from your actual visitors. However, automatic testing is nevertheless a great place to start and can give you a good overview of your site’s overall performance.
As always, we’ve included the performance results of the world’s biggest blogs, e-commerce sites and newspapers to benchmark against. You’ll find these results listed under each section.
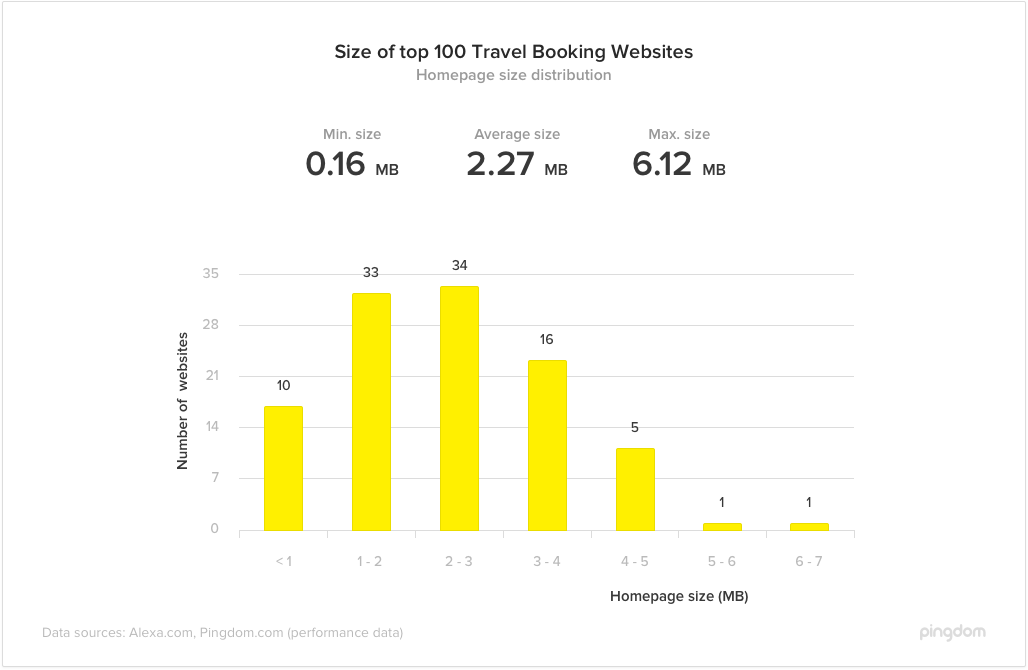
Homepage sizes ranged from 0.16 MB to 6.12 MB
As always, we looked at the size of each site’s homepage because, let’s face it, size matters. Especially when it comes down to site load time. The average size of the 100 websites is 2.27 MB, which places the majority (62%) of sites tested well within the 2.48 MB global benchmark.
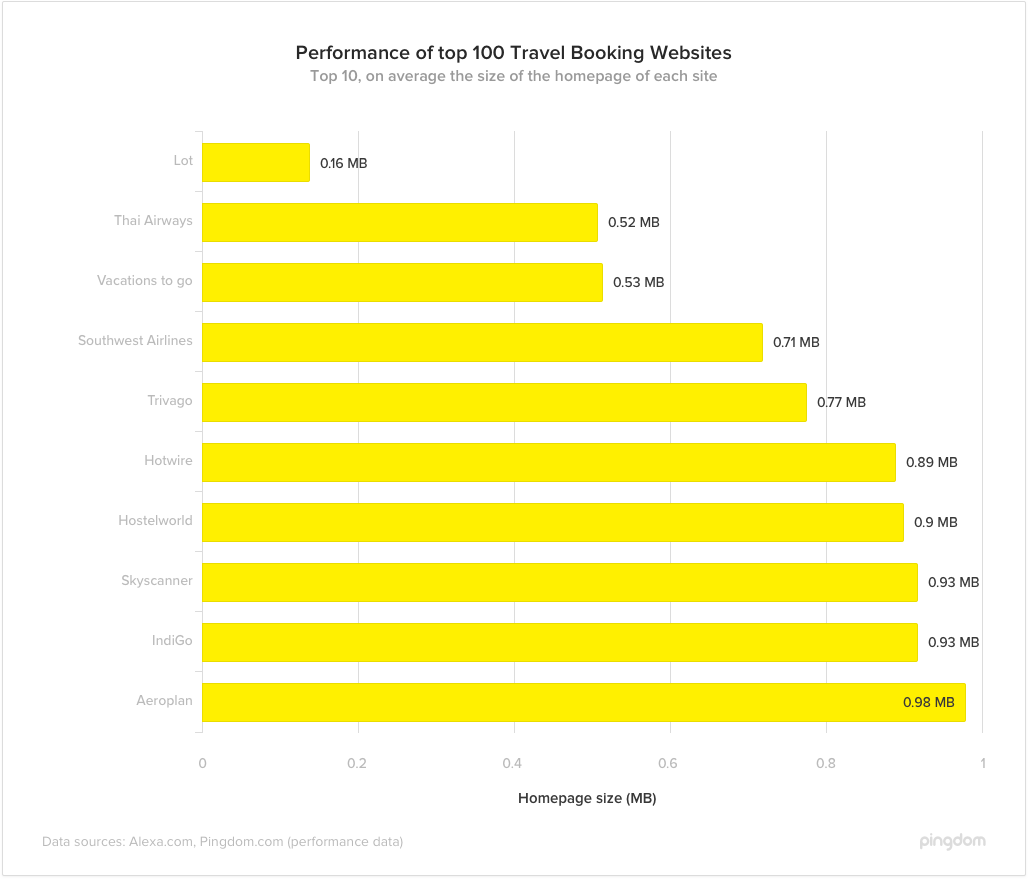
The lightest page was the Polish flag carrier airline Lot at a mere 0.16 MB, followed by Thai Airways at 0.52 MB and Vacations To Go at 0.53 MB, making the latter two the smallest travel websites we tested in Asia and North America respectively.
It’s worth mentioning that of the top 3 websites tested, in terms of size, only Lot and Vacations To Go feature in the top 10 websites in terms of speed.
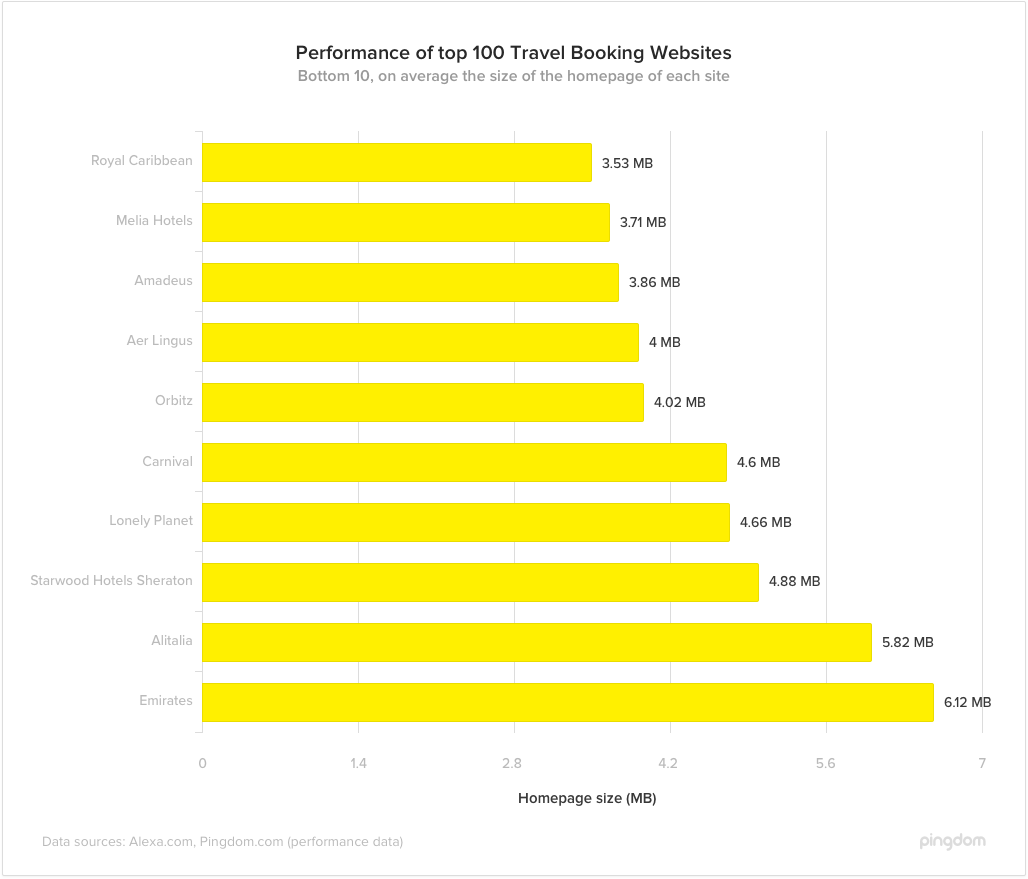
Below you can see the top and bottom 10 travel sites in terms of homepage size:
On the other side of the coin, we found that 38 of the 100 websites we tested were over the 2.48 MB benchmark, with the largest site—Emirates—coming in at a whopping 6.12 MB. To put that into perspective, the biggest site was almost 56 times bigger than the smallest. The two next-biggest sites were Alitalia at 5.82 MB and Starwood Hotels Sheraton at 4.88 MB.
Pingdom benchmark: average homepage size
- Blogs: 4.82 MB
- E-commerce: 2.55 MB
- Newspapers: 3.45 MB
- Travel Sites: 2.27 MB
Travel sites are optimized for speed
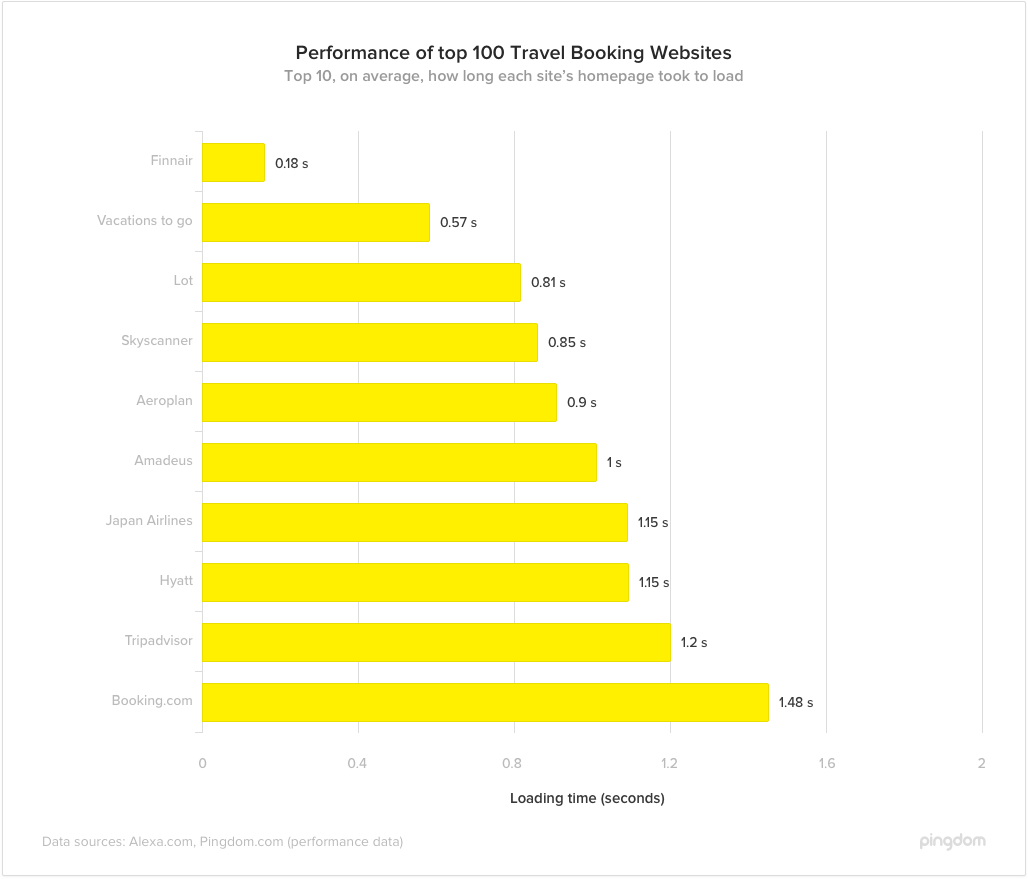
With hotel rooms and airplane tickets being both limited in quantity and sold in real time, it is essential for any travel site worth it’s salt to be optimized to load quickly. With that in mind, we were impressed by Finland’s flag carrier airline, Finnair, whose site came in fastest at a mere 0.18 seconds. Interestingly, they placed 18th in terms of size, which goes to show that a small site doesn’t necessarily mean that it loads quickly.
Of the 100 travel sites we tested, only 6 websites loaded in 1 second or less, with Vacations To Go (0.57 seconds) and Lot (0.81 seconds) coming in second and third places respectively, after Finnair.
The majority of the sites loaded within 4 seconds, with the average load time being 3.39 seconds. You can see the distribution of load times in the graph below:
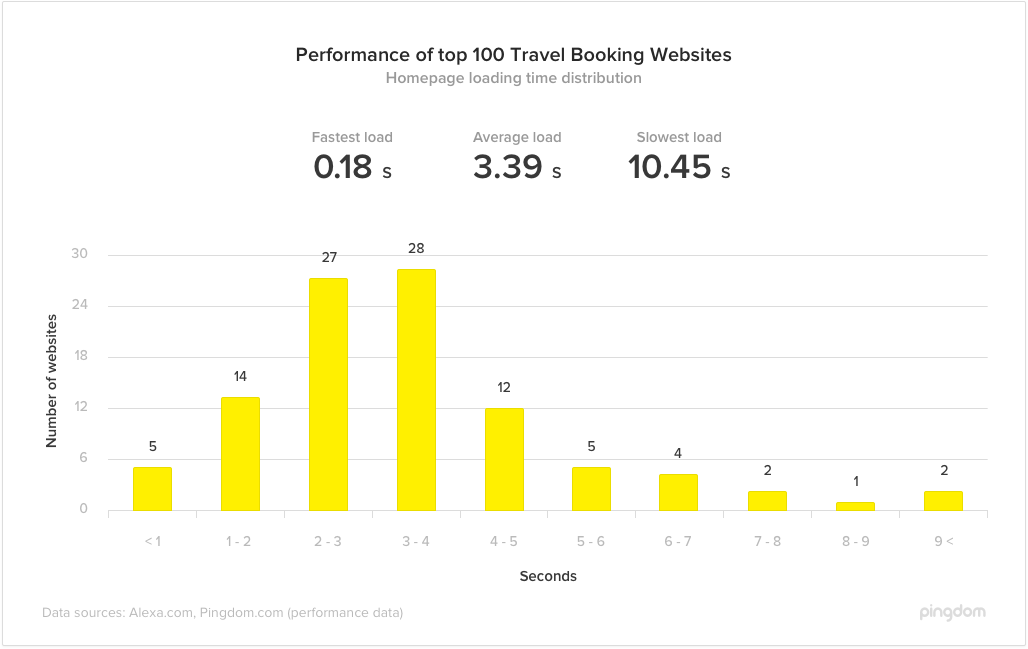
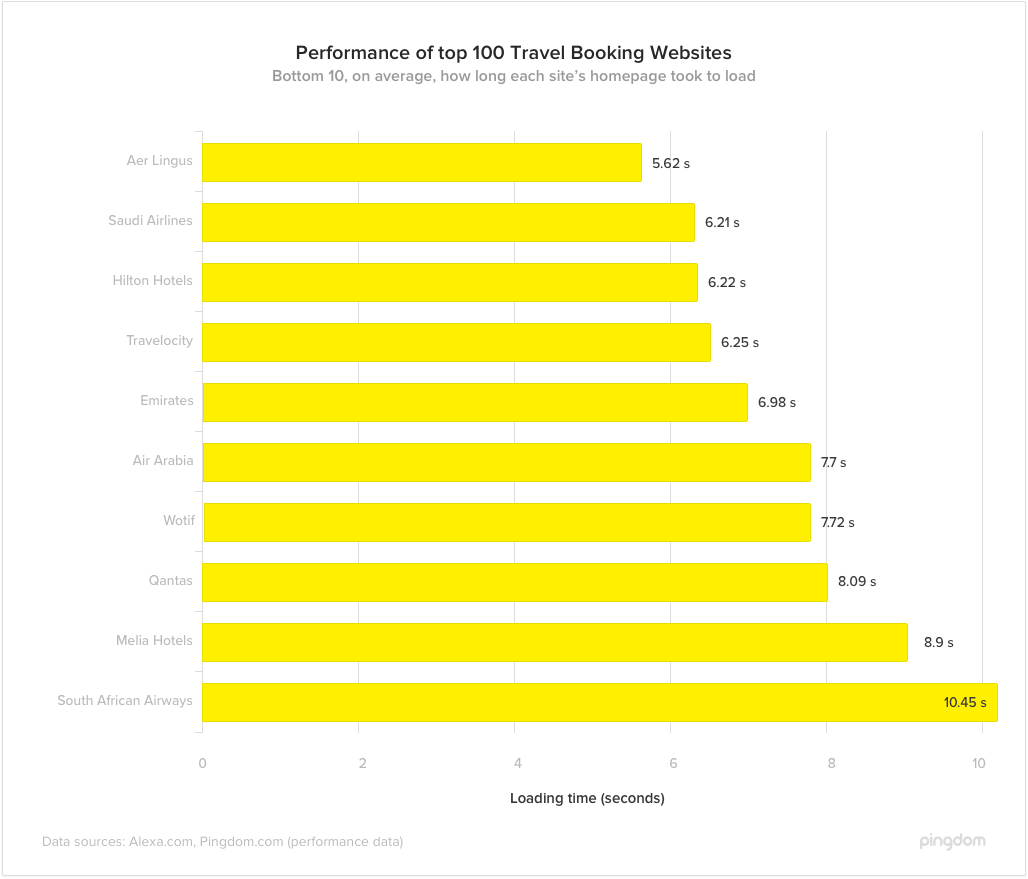
The slowest site was South African Airways, which loaded in 10.45 seconds, meaning that the fastest site could load 58 times in the same amount of time it would take for the slowest site to load once. An average of 3.39 seconds makes the average travel site faster than both the top 100 newspapers and blogs. However, in a fast paced industry such as travel, many travel sites should look to bring their load speed below 2 seconds. Below you can see the top 10 fastest and slowest sites:
Pingdom benchmark: average homepage load time
- Blogs: 5.48 seconds
- E-commerce: 2.51 seconds
- Newspapers: 4.57 seconds
- Travel Sites: 3.39 seconds
Number of HTTP requests
A big factor in the performance of any website is the number of requests it has to make every time a user loads it. A request can be made for any type of element on the site, including JavaScript, CSS and image files.
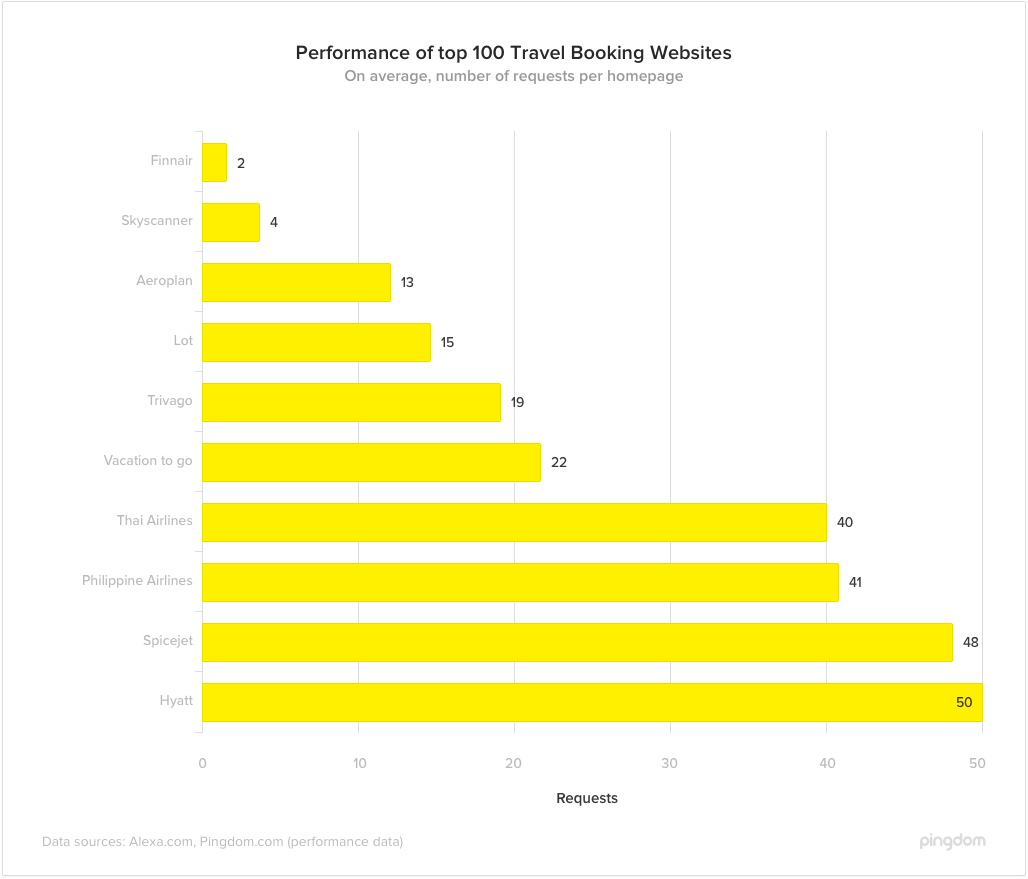
We found that the average number of requests made by the 100 websites we tested was 142, which is the lowest average across all of the type of sites we’ve tested in the past. The site with the fewest requests was Finnair, which had an astonishing 2 requests per load. Right after them, it was flight-comparison site Skyscanner with only 4 requests and Aeroplan with 13 requests, to round off the top 3.
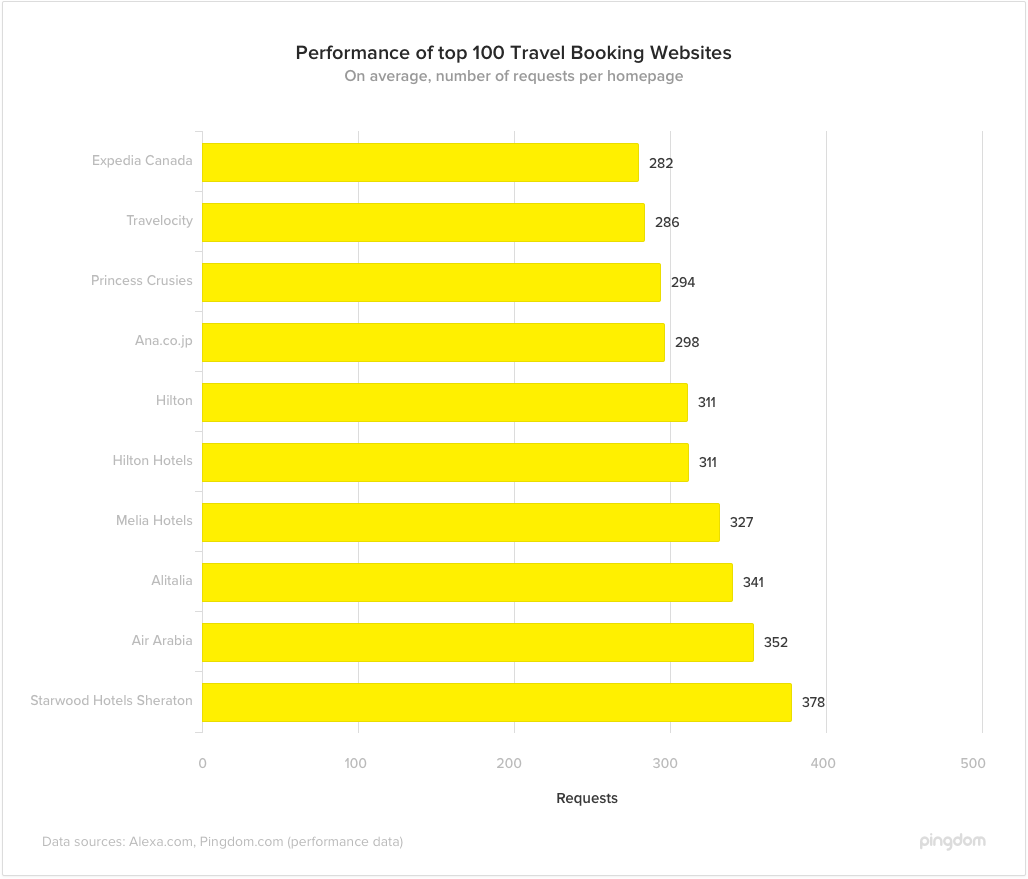
Below you can see the distribution of the number of requests per site:
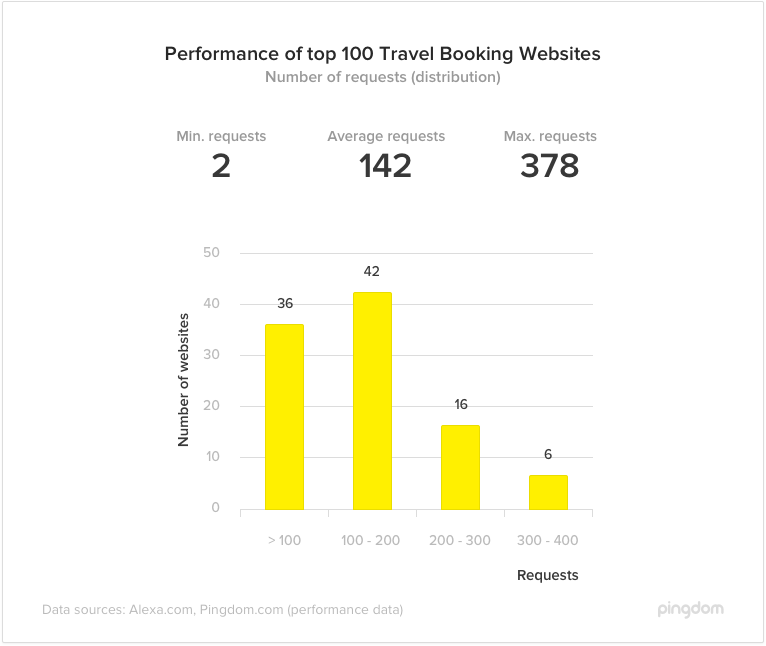
Interestingly, the site with the highest number of requests—Starwood Hotels Sheraton—was also the largest site we tested, with 378 requests made per load. To put this in perspective, the largest site makes 189 times more requests than the smallest of our test cohort!
Below you can the see the top and bottom 10 travel sites in terms of the number of requests made upon load:
Pingdom benchmark: average homepage load time
- Blogs: 367 requests
- E-commerce: 169 requests
- Newspapers: 250 requests
- Travel Sites: 142 requests
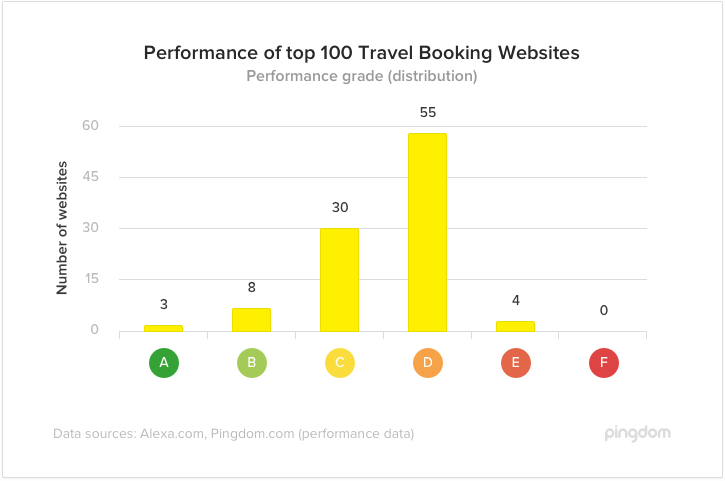
Performance Grade
The performance grade tells us how a website conforms to web performance best practices according to YSlow. Of the 100 sites tested, only 3 received an ‘A’ grade and a further 8 sites achieved a ‘B’ grade. Over half of the sites received a ‘D’ grade, with 30 websites achieving a ‘C’ grade.
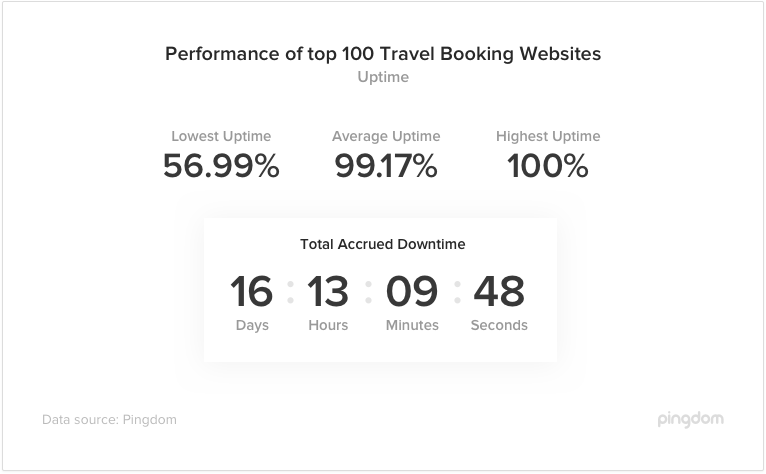
Site availability is crucial
Unlike in previous web performance tests we’ve run, this time we monitored the availability of each site. Holidays, flights and hotel bookings are still ‘considered purchases’ where consumers will visit multiple times before converting. With market competition so fierce and abandonment rates high across the online travel industry, making sure that your site is available when a potential customer wants to make a booking is crucial.
Thankfully, the majority of sites tested delivered a 100% uptime rate across the 2 week test period. However, some websites did suffer from major downtimes throughout the test period, with the lowest uptime being only 56.99%n on Lufthansa’s homepage. However, as we monitor site availability through automatic testing, there could be a number of factors that would affect the accuracy of the uptime test, like denial of access to bots etc. Regardless, all websites should have an uptime monitoring solution in place as a few minutes of downtime during business critical seasons can mean large losses in revenue. The average uptime across all sites tested was 99.17%, which may appear as a pretty good result on face value, but still means that a site with said uptime would still experience unavailability for 6 hours and 3 minutes a month!
How do travel sites rank in terms of User Experience?
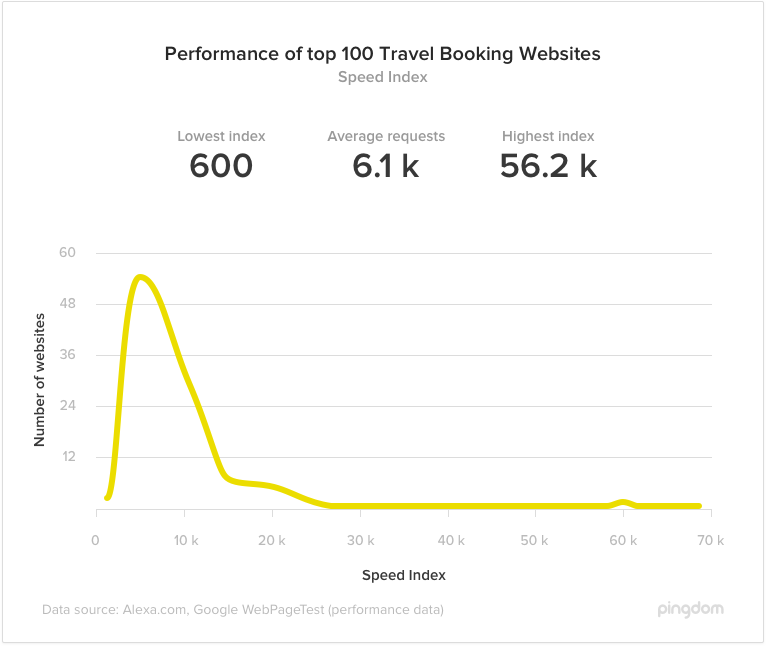
Google Speed Index measures how quickly the web page content appears up on the screen, while Page Speed measures how long everything takes to fully load. You may argue that Speed Index is a better indicator of user experience since, as a user, you are probably mostly interested in when you can see content.
The caveat here is that Google’s Speed Index is made up of a scale that, unless you’re a developer and into this, is really difficult to understand. Paul Irish, from the Google Chrome team, recommends a speed index of under 1,000 and to deliver the above-the-fold content in the first 14kB of the page.
Of the all the sites tested, only one of the 100 achieved a speed index of 1000 (congratulations Aeroplan!) with the average sites achieving an aggregate index of 6134.
Travel website performance is good but can be better
Gone are the days of going to your local travel agent to book your holiday. In fact, according to ABTA, 76% of people book their holidays online nowadays. Does the web performance of your favourite airline affect whether you’ll wait for their site to load or simply find a better deal somewhere in less time?
The results, we found, were mixed when it comes to how well-optimized travel sites are. Some were incredibly fast and small in size whilst other took a whopping 10 seconds to load in a browser! Clearly, like with newspapers, there is a long way to go before we can raise the benchmark for travel website performance.
You might want to run your site through our Website Speed Test and see how it compares with the benchmarks mentioned here. You can run an automated performance and uptime test in our dashboard when you sign up for our service.


