


2021 holiday travel has been a rebound for the industry. Just this week, I was attempting to purchase flights for a long weekend before travel picks up for the holidays. However, after a failed attempt to sign up for their Executive Club and enduring slow page loads after every click, I abandoned the site and booked elsewhere. Just like that, I was a lost customer. As both domestic and international travel picks up throughout the last month of the year, I wanted to analyze the web performance of the world’s top travel sites and see how prepared (or unprepared) organizations are for online bookings going into the new year.
Let’s dive into the data of the top 50 travel sites so you know which sites are fast and reliable when you’re trying to reserve your next getaway.
The Data and How We Tested Web Performance
We gathered our list of the top 50 travel sites based on traffic, according to traffic authority Similar Web.
We then tested the homepage for each site from our nearest test location to provide the optimal load time for each site. Our page speed monitoring tool tested each website every 30 minutes for a week between November 15 and November 22, 2021. All results displayed are the average across the time period.
Additionally, tests were performed only on the desktop versions of each site.
Benchmarks
The average stats from our 2017 analysis were as follows:
- Average homepage size: 2.27MB
- Average homepage load time: 3.39 seconds
- Average number of requests: 142 requests
We’ve also included the performance results of the world’s biggest blogs and e-commerce sites to benchmark against. You’ll find these results listed under each section.
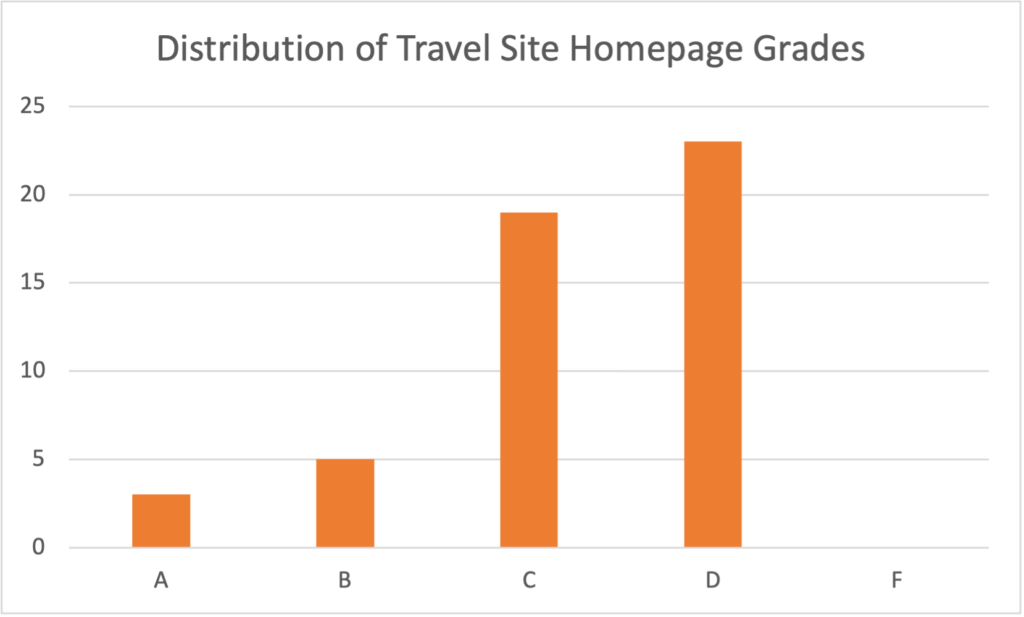
Travel Sites Web Performance Rake in the “Ds”
Starting off the analysis not so strong. The performance grade tells us how a website conforms to web performance best practices according to YSlow. Of the 50 sites tested, only three received an “A” grade, and a further five sites achieved a “B” grade. What a bummer. Nineteen of the sites (38%) received a “C,” and 23 of the sites (46%) received a “D.”
What led to these low grades? Let’s dig deeper into the performance trends.
SolarWinds® Pingdom® Benchmark: Average Homepage Grade
- Blogs: D
- E-Commerce: C
- Travel Sites: C
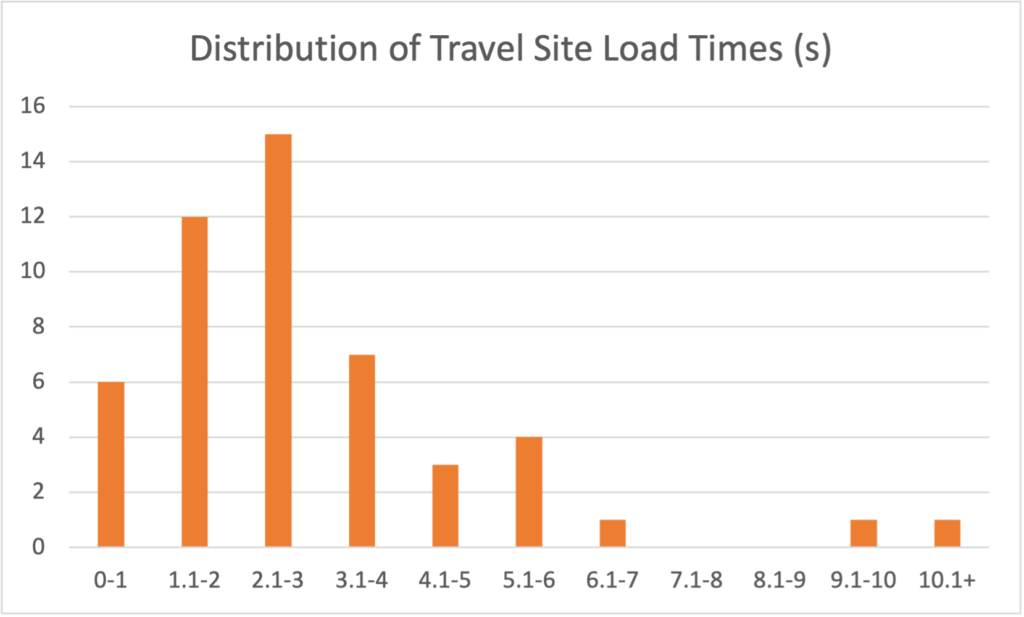
66% of Travel Sites Load in Three Seconds or Less
Despite low performance grades, the top 50 travel sites are optimized for load speed. This could be due to a low number of elements on the homepage (we’ll get into requests later) in addition to smart development to make sure the elements present (think beautiful destination photos and videos) load fast.
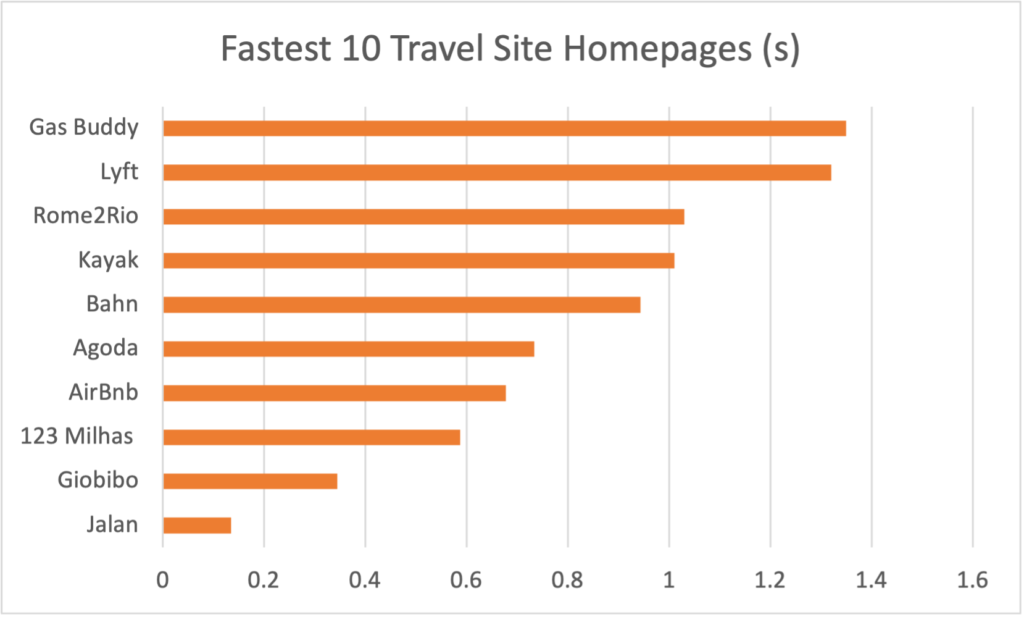
Fastest 10
If you read our last web performance analysis post, you know the recommended load time is three seconds or less. With the average homepage loading in 2.9 seconds, these travel sites are quick. In fact, six of the quickest 10 sites loaded in under a second, with Jalan (which also scored an “A”) coming in at 0.135 seconds.
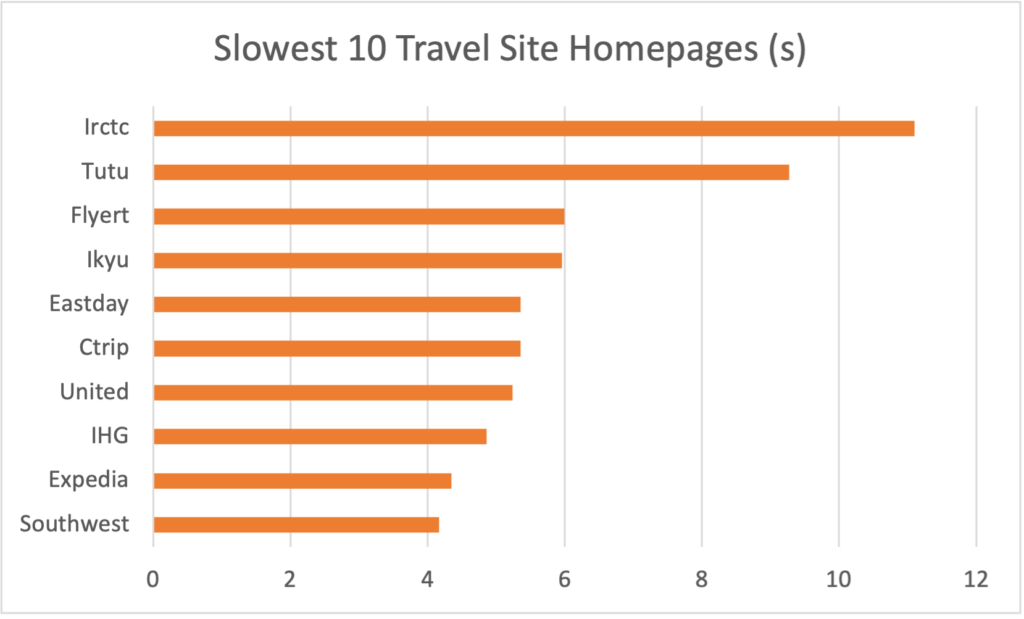
Slowest 10
The slowest site, Indian Railway Catering and Tourism Corporation (IRCTC), loaded in just over 11 seconds, meaning Jalan could have loaded 82 times before IRCTC finished once. Here’s something interesting about both the fastest and the slowest sites: both homepages contain several third-party display ads, meaning they both have additional (and unnecessary) code and calls.
Pingdom Benchmark: Average Homepage Load Time
- Blogs: 3.94 seconds
- E-Commerce: 2.87 seconds
- Travel Sites: 3.39 seconds
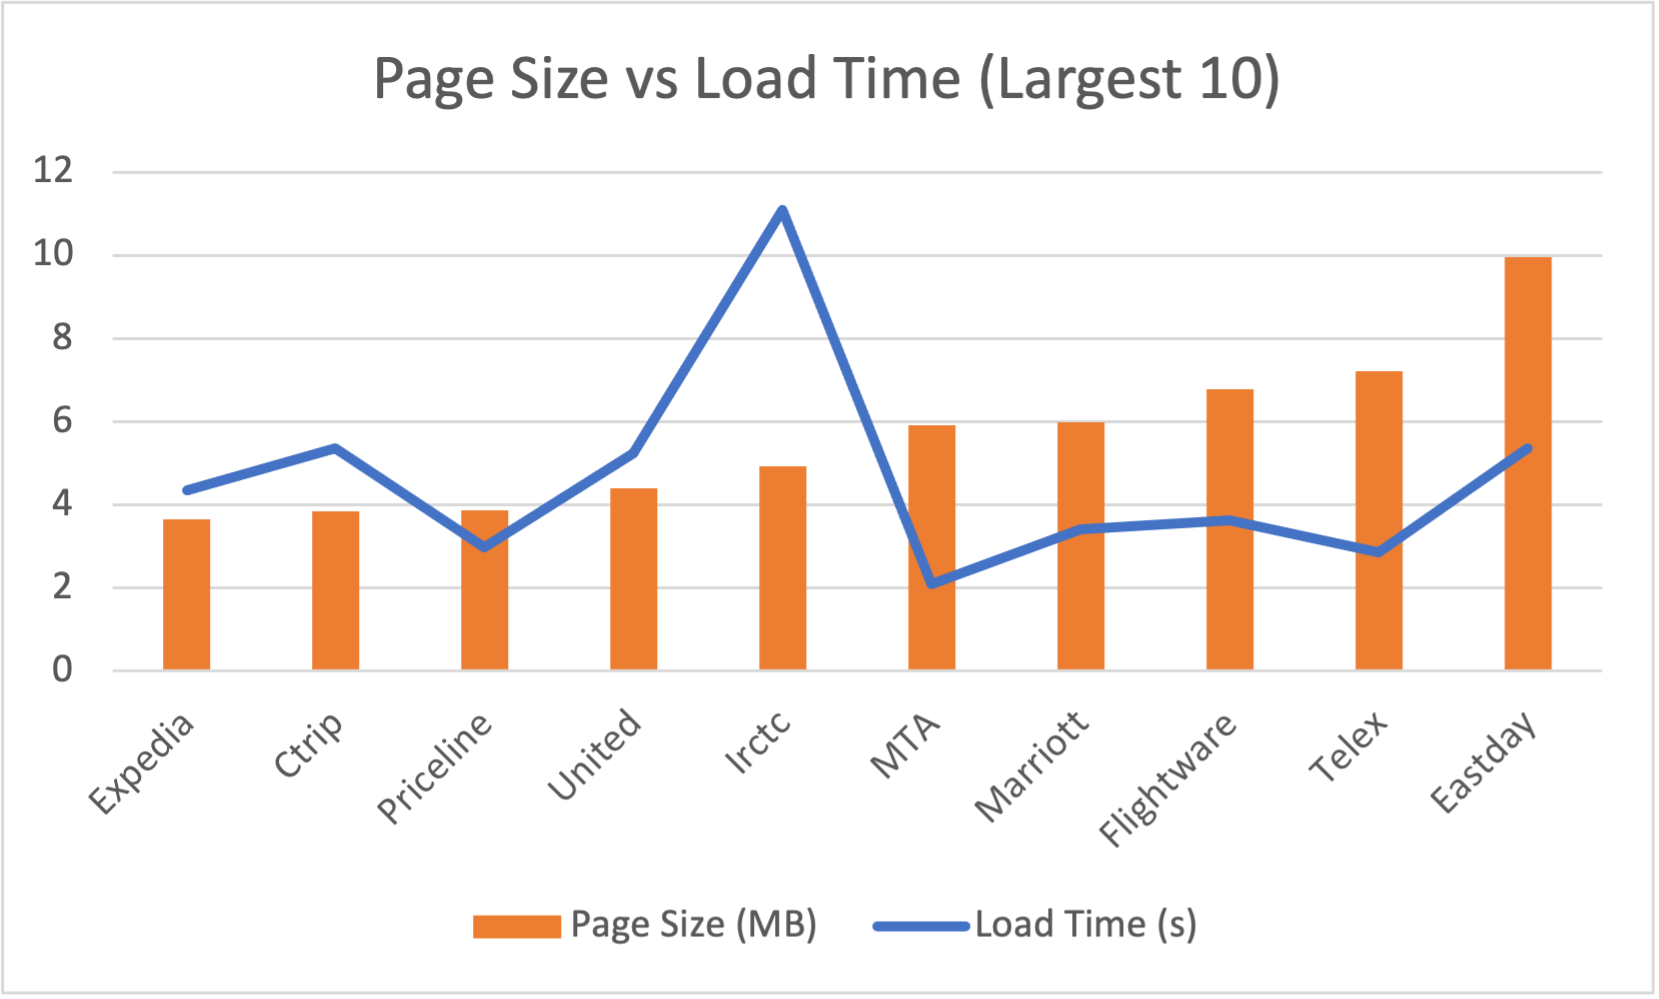
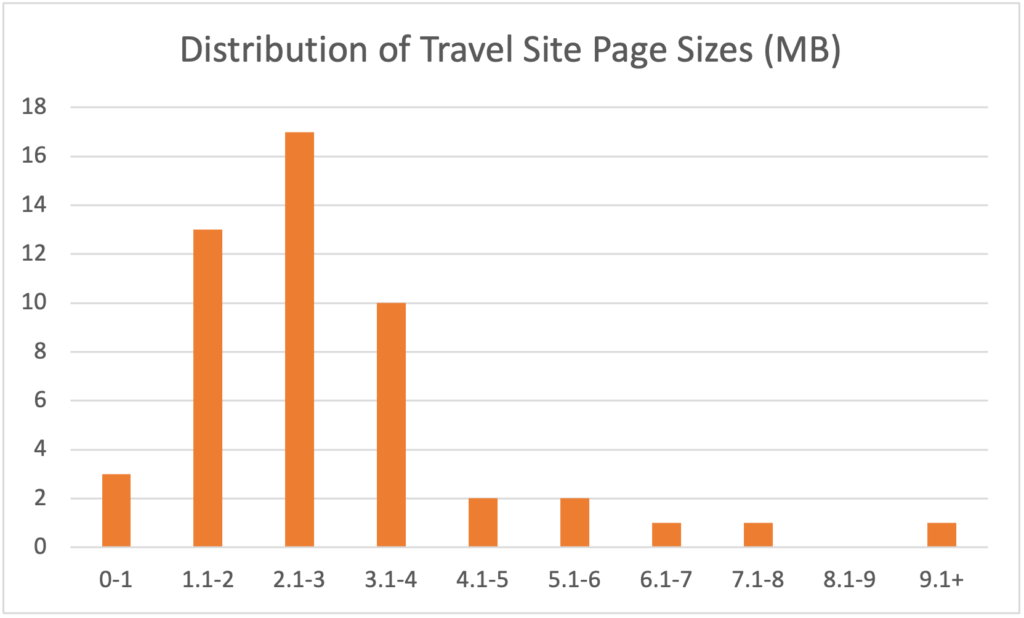
Page Size Varied From 0.027MB to 9.95MB
Homepages have grown since 2017, but has their functionality? In our last analysis, Southwest Airlines was one of the smallest homepages, weighing in at 0.71MB. In 2021, Southwest’s site averaged 2.7MB during our testing. The kicker: when reviewing the homepage from March 2017, the site was extremely similar to its current site, meaning the larger size could be due to additional tracking and retargeting codes or a lack of optimization.
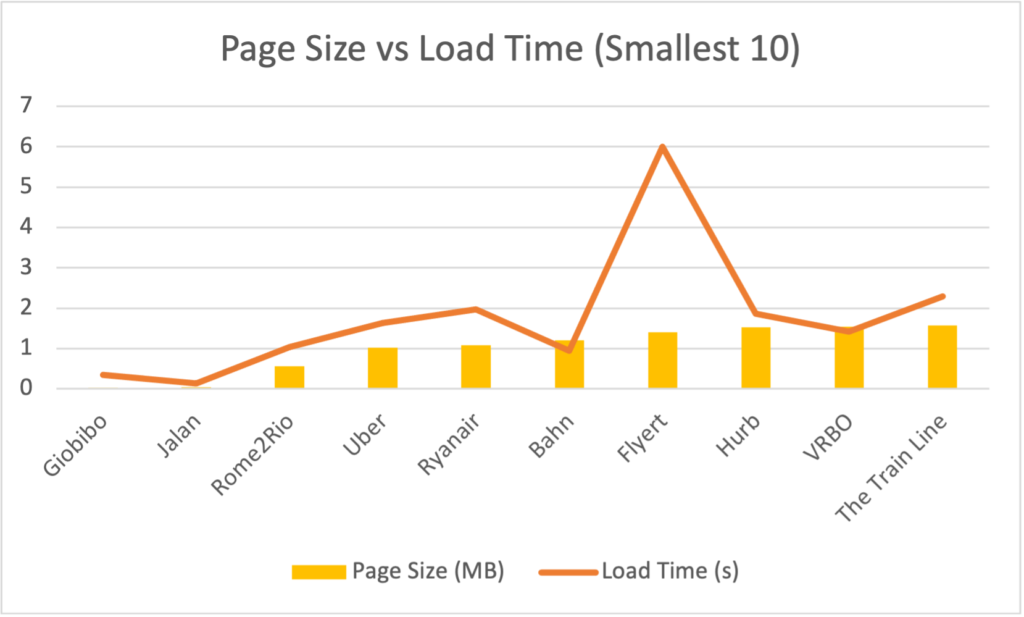
When reviewing how page size correlates with load time, we can see a clear relationship for our smallest 10 homepages: as the size grows, so too does load time. Unfortunately for Flyert users, despite a relatively small page, the load time will have them pause for an average of six seconds before they can access the full page.
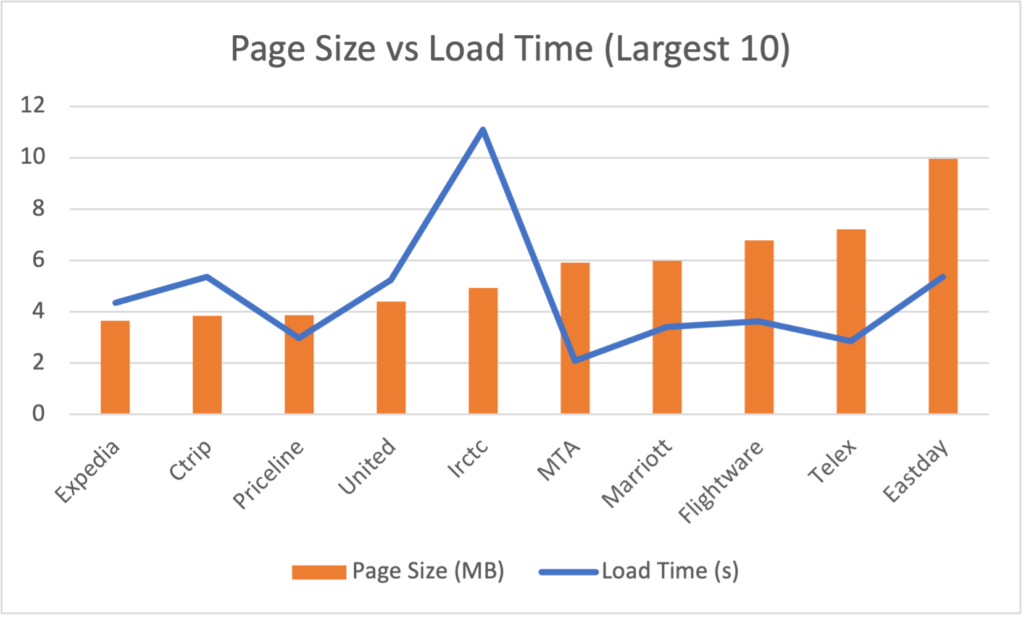
Though the trend isn’t as clear with the larger sites, load time tends to stay above three seconds.
Pingdom Benchmark: Average Homepage Size
- Blogs: 5.9MB
- E-Commerce: 3.43MB
- Travel Sites: 3.49MB
The Average Request Count Was 181
Let’s think about what’s needed on a travel site’s homepage: a booking widget, some beautiful images or videos, and current deals to highlight. Luckily for travel sites, there are few additional elements needed for a complete homepage. This means travel sites benefit from a lower number of necessary requests, such as JavaScript, CSS files, etc.
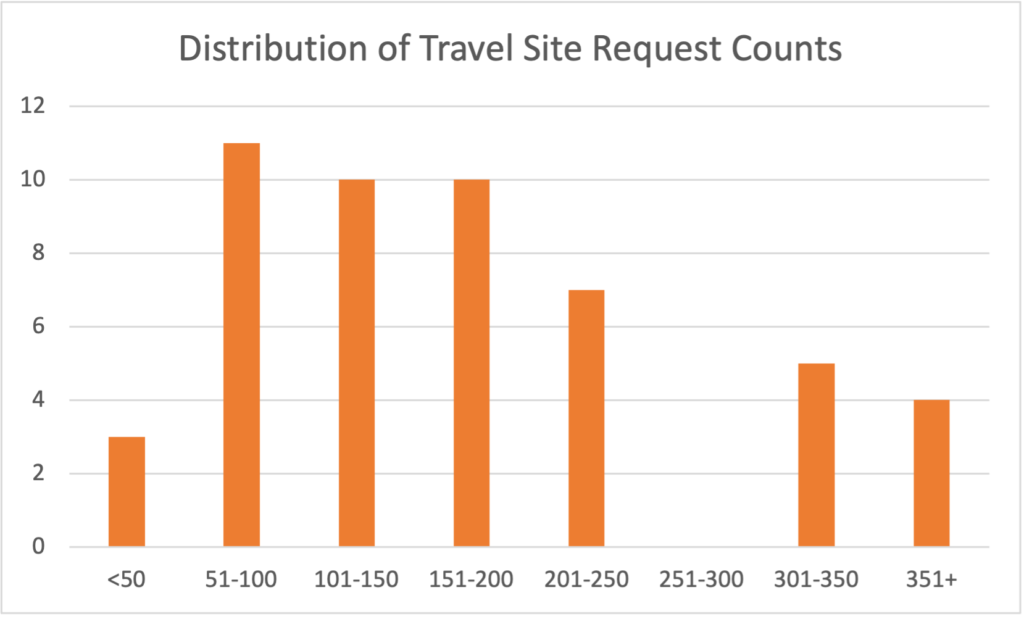
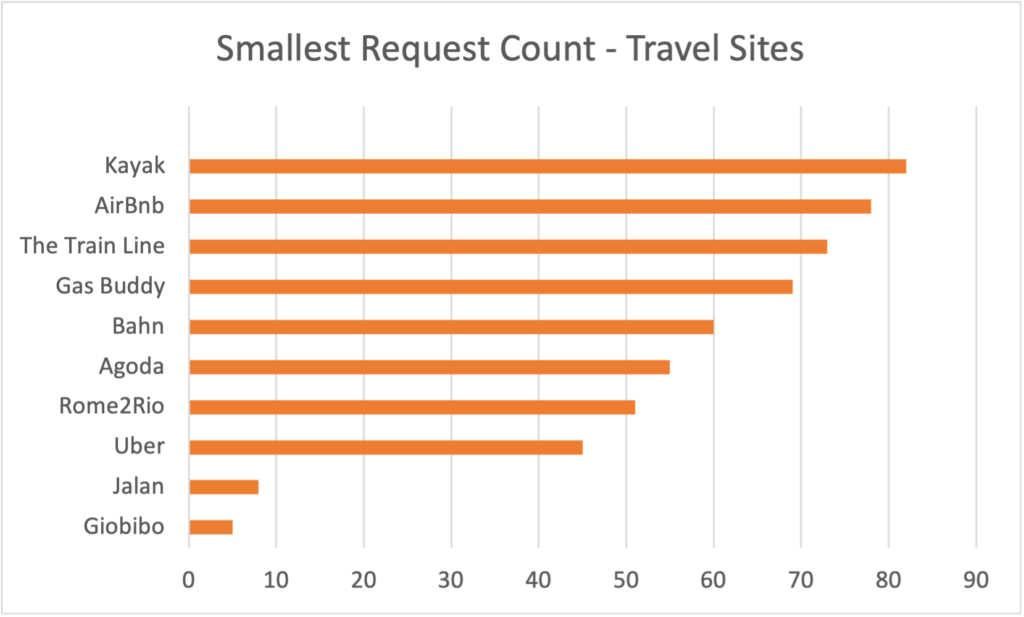
In fact, one of our tested sites contained only five requests.
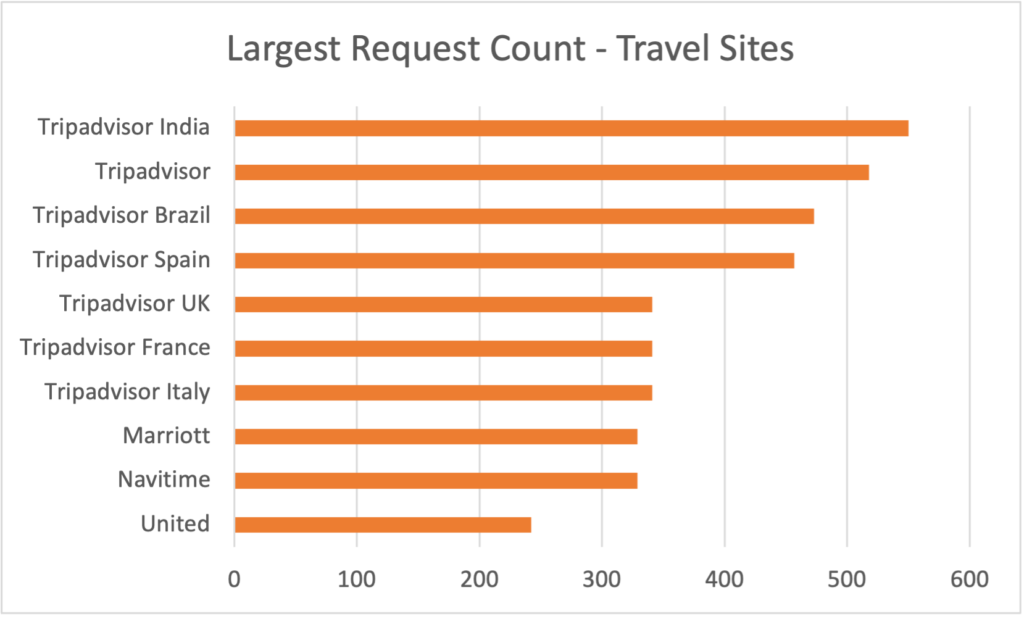
Each of the seven TripAdvisor sites that made it to our analysis contained the largest number of requests, but they still scored “Bs” and “Cs” for performance.
Travel Website Performance Is Good but Can Be Improved
Are you booking on any of these sites? What issues have you run into when trying to book a flight, lodging, or other travel arrangements?
Please run your site through our website speed test and see how it compares with the benchmarks mentioned here. You can also run an automated performance test every 30 minutes on our dashboard when you sign up for a 30-day free trial.


