Working in the performance industry you’re surrounded by many technical terms. Of course, we need to have many terms and phrases to be able to communicate about specifics.
There’s no doubt that much of what we deal with on a daily basis can be very complex, so we need to be careful with how we label and describe things.
This post was originally published on the Speed Awareness Month blog.
Follow best practice
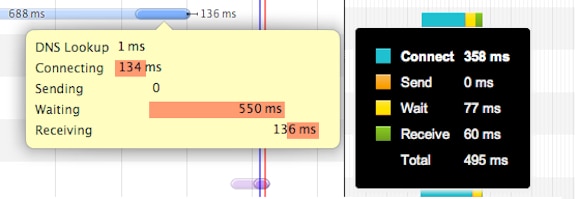
At Pingdom, this has become more and more apparent to us, especially as we’ve been introducing new services. To avoid misunderstandings, we always try to use terms and phrases that seem to be the best practice at the time. Sometimes this can be very hard. Especially in situations where there are several words for the same thing or one word has several meanings or when you can use different words depending on what you want to focus on. For example you can talk about connect time, but you could also talk about request time or back-end time which includes the connect time.
Wouldn’t it be great to have a sort of dictionary with best practices and recommendations for how we in the web performance industry should use terms and phrases? Following on what Steve Souders has been saying for awhile that we need to standardize the tools we use, we certainly think so.
Measures and marks of the performance beast
To illustrate this, I want to highlight two words which at least I haven’t used correctly. These are measures and marks which are taken from a W3C specification.
- Measures – The time it took to complete one or several tasks.
- Marks – The time it took to get to a certain state from the start of the timeline. (the onLoad event for example)

The concept has always been clear but I have missed the actual words to use to separate them. W3C finally gave a suggestion for words to use to distinguish them.
Some web performance terms and phrases
Now, let’s dive into my (most likely incomplete) list. I compiled this list from various places around the web.
- Redirecting – The time it takes to perform possible redirections.
- DNS lookup – The time it takes to look up a domain name’s IP address.
- Connecting – The time it takes for the client to connect to the server.
- Sending – The time it takes for the client to send the request to the server.
- Receiving, Response, Download – The time it takes to receive the answer from the server.
- DOM processing – Parsing and interpreting the HTML.
- Rendering – Displaying the page, running in-line JavaScript, and loading images.
- Waiting – Time spent waiting.
- SSL Negotiating – Negotiation of encryption through SSL/TLS.
- Blocking – The time where blocking has occurred because the client was using all connection threads.
- Backend time – The combined time of redirecting, DNS lookup, connecting, sending, and receiving.
- Frontend time – The combined time of DOM processing and rendering.
- Time To First Byte (TTFB) – Indicates the time that has passed since a request was initiated until the first byte was received by the client. Note: While some measure the total time it takes from the action that triggered the request to receiving the first byte (a mark), others measure from when the last byte of the get request was sent until the first byte is received (a measure).
- Mark_fully_loaded – This is a recommendation from the user timing spec, which indicates the time when the page is considered fully loaded as marked by the developer in their application.
- Mark_fully_visible – This is a recommendation from the user timing spec, which indicates the time when the page is considered completely visible to an end-user as marked by the developer in their application.
- Mark_above_the_fold – This is a recommendation from the user timing spec, which indicates the time when all of the content in the visible viewport has been presented to the end-user as marked by the developer in their application.
- Mark_time_to_user_action – This is a recommendation from the user timing spec, which indicates the time of the first user interaction with the page during or after a navigation, such as scroll or click, as marked by the developer in their application.
- DOMcontentReady, Start render, time to first paint – The browser fires the DOMcontent event.
- OnLoad – The browser fires the onLoad event.
I’m sure there are more out there, but this should at least get us started.
One specific example of where there is a risk of confusion would be Time To First Byte because people don’t always have the same definition on what it means. Another, maybe less critical example is Receiving, Response, Download, which all have the same meaning.
What’s your point?
I started writing another article, and I thought everything was clear. Then I realized the possibility of comment onslaught I could trigger, and this was all just because of the words I was using and their possible meanings which opened up for confusion.
W3C has some terms which they use in its specifications. For example, the use of measures and marks, and the recommendations outlined in the user timing specification explained above. I like this approach and would like to see more recommendations from the W3C and others, both for terms and phrases and coding conventions. But if that doesn’t happen, we should try to fix it together within the industry.
David Rydell is titleless but works with marketing and product development in Pingdom. He has among other things been involved in Pingdom Full Page Test, Pingdom Transaction Monitor and Pingdom Real User Monitoring. You can start using Pingdom for free by signing up at www.pingdom.com/website-monitoring. David is not active on Twitter, but in case of an emergency, you can get a hold of him through Pingdom.


