


Introduction
We all want the fastest application possible for our customers. At the same time, we’re under pressure to continuously add new features. These new features add complexity, which makes our application heavier, which in turn slows our applications down.
So, how do we add new features, yet keep the performance of our application high?
In this article, we’ll look at how you can achieve fast speeds by using SolarWinds® Pingdom® to optimize Apache web server on DigitalOcean. DigitalOcean is the perfect solution to launch and scale your application—it provides fast connections, worldwide data centers, and easy control of deployments. And Pingdom is the ideal addition to DigitalOcean for measuring and optimizing our website speed. Together, they provide the perfect solution for fast, scalable, and reliable applications.
Let’s start by setting up a sample website on DigitalOcean using Apache and WordPress (to simulate our web application). Then we’ll walk through how to measure and improve our site speed using Pingdom. If you already have a website, you can skip the setup and start from the “How to Understand Your Website’s Speed” section.
Creating Your Droplet
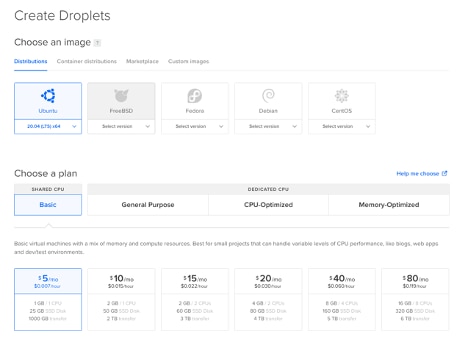
First, we need to create our Droplet on DigitalOcean. This is simple and takes just a few steps.
For our example, let’s choose an Ubuntu 20.04 image and the most basic plans for our Droplet.
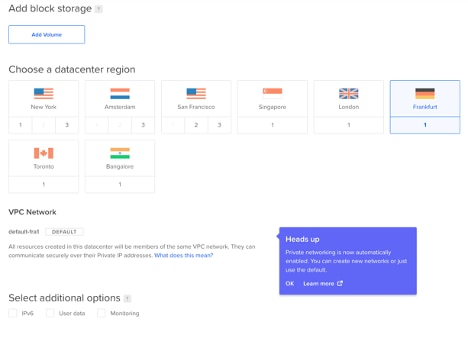
Next, select the closest location to your targeted audience and any additional options.
For authentication, we’ll select SSH Keys (as they’re more secure). If you don’t have a key, just create one using the DigitalOcean tutorial shown after you click “New SSH Key.”
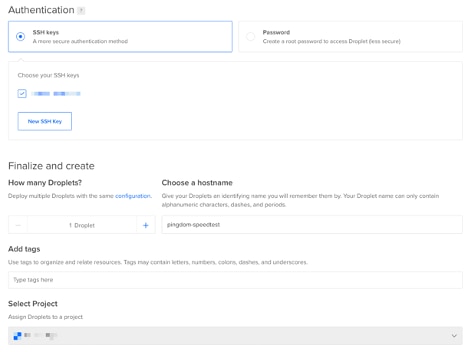
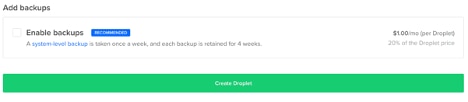
Finally, click the “Create Droplet” button.
We can now see our public IP on the right side of the hostname.

Setting up Your Applications
Now that the Droplet is created, we need to update the package index, upgrade outdated packages, and install Apache and any required packages for our simple WordPress application.
apt-get update && \
apt-get upgrade && \
apt-get install -y && \
apache2 \
php7.4 \
php7.4-mysql \
mysql-server \
To quickly verify the web server is responsive, you can browse to your droplet’s IP:
http://<droplet-external-ip>/ Creating the MySQL Database and User
Next, let’s create a small database for our application. Use the “mysql” utility to create a MySQL shell.
mysql You should see something similar to the following:
Welcome to the MySQL monitor. Commands end with ; or \g.
Your MySQL connection id is 24
Server version: 8.0.22-0ubuntu0.20.04.2 (Ubuntu)
Copyright (c) 2000, 2020, Oracle and/or its affiliates. All rights reserved.
Oracle is a registered trademark of Oracle Corporation and/or its affiliates. Other names may be trademarks of their respective owners.
Type 'help;' or '\h' for help. Type '\c' to clear the current input statement.
mysql> Now create the database with the “CREATE DATABASE” command.
mysql> CREATE DATABASE mywordpress;

Query OK, 1 row affected (0.01 sec)
Create your user using “CREATE USER.”
mysql> CREATE USER "mywordpressuser"@"localhost" IDENTIFIED BY "Duc90okpwmFaN8VYhA8n2M";

Query OK, 0 rows affected (0.01 sec)
Grant the necessary privileges to the created user.
mysql> GRANT ALL PRIVILEGES ON mywordpress.* TO "mywordpressuser"@"localhost";

Query OK, 0 rows affected (0.01 sec)
Flush the privileges.
mysql> FLUSH PRIVILEGES;

Query OK, 0 rows affected (0.01 sec)
Now exit the shell.
mysql> exit

Bye
Installing WordPress
For the last step, we need to install WordPress. Change the current directory to the Apache default document root.
cd /var/www/html/ Download the latest WordPress files.
wget https://wordpress.org/latest.tar.gz Extract the files to the current directory.
tar -xzv --strip-components 1 -f latest.tar.gz Remove the archive.
rm latest.tar.gz Copy sample wp-config,php, so we can edit the configuration
cp wp-config-sample.php wp-config.php Open wp-config.php with your favorite editor.
nano wp-config.php To finish, change a few values you set earlier in the MySQL section:
- DB_NAME
- DB_USER
- DB_PASSWORD
Also be sure to update the following (you can generate new unique phrases using this link https://api.wordpress.org/secret-key/1.1/salt/):
- AUTH_KEY
- SECURE_AUTH_KEY
- LOGGED_IN_KEY
- NONCE_KEY
- AUTH_SALT
- SECURE_AUTH_SALT
- LOGGED_IN_SALT
- NONCE_SALT
- NONCE_SALT
How to Understand Your Application’s Speed
With our application set up, we’re ready to get started! Let’s look first at understanding your application’s speed.
An application’s speed can be affected by many different aspects such as back-end functions, database connection and queries, page sizes, component sizes, external requests, and so on. The total time for your page to load is the sum of these different aspects. Here’s a typical timeline with the different stages:
| Timeline Term | Description |
| DNS | How long it took for the DNS query |
| SSL | Time passed for SSL negotiations |
| Connect | Time to connect |
| Send | Time elapsed while sending the request data |
| Wait | Time to wait for the remote side |
| Receive | Time elapsed while receiving the response data |
| First byte received | When the first byte is received |
| DOM content loaded | Page components loaded |
| On load | Page fully loaded, run scripts and ready for viewing |
For this portion of the article, we’re going to focus on the broader “On load” time.
For more information, please see How to Analyze Website Speed Test Results and A Beginner’s Guide to Web Performance.
Introduction to Pingdom
Now let’s look at SolarWinds Pingdom and how it can help you speed up your Apache web server.
First, create an account. Once you’ve created an account, the Pingdom main page will show you several recommended monitoring options. Please refer to the Getting Started With Pingdom guide for detailed information on each feature.

We’ll focus on the “Page Speed” check. Click that option.
Setting a Baseline With Pingdom
To start monitoring, fill out the requested information on the next screen:
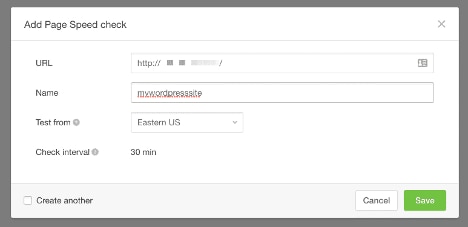
Select the closest location based on your site’s location in “Test from” field. Once your check is created, give Pingdom a few minutes to create your first report. Once the report is ready, click the report link under the “Latest tests” list. This “default” speed of our application, without any tweaks, is going to be the baseline data we work from.
With this initial report, Pingdom also gives us a lot of information we can use to improve our website’s speed. At the top of the report, you’ll see a few statistics for your page: “Performance Grade,” “Load time,” “Page size,” and number of “Requests.”
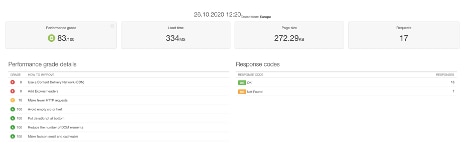
You’ll also see Performance Grade Details, a built-in smart analysis showing you ways to improve your site speed. For example, here you see “Use CDN” and “Add Expires headers.” Using a Content Delivery Network (CDN), for example, can dramatically increase your web application’s speed. (For more information about CDN please see A Beginner’s Guide to Using CDNs.)
In this view, you’ll also see content size and requests by content type.

You’ll also see content size and requests by domain. This information can show us if one or more of our resources is being loaded from an external site, which could affect performance.

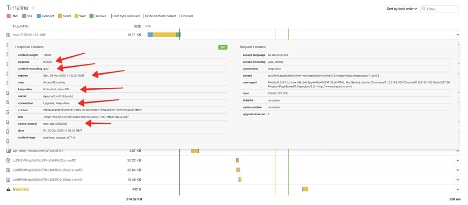
One of the most important views is “Timeline.” This view displays a timeline of the requests. Various metrics appear in alignment with each file loaded. This can help us identify trouble spots.
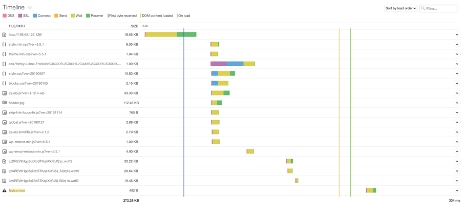
We can also dig deeper and see the details of each file. Here, request and response headers are shown.
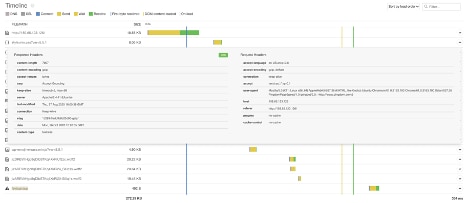
With this information, we can see “content-encoding” is already using gzip. This means Apache is already compressing components by its default configuration.
Optimizing Apache
Now that Pingdom is set up and monitoring our website, let’s look at a few ways—based on the reports above—we can configure Apache to improve our load times. We’ll use Pingdom to confirm our changes have helped. Using their page speed analysis toolsets, we can clearly see and finely tune these settings to fit our needs. There are a seemingly infinite number of knobs to turn, but we’ll use some best practices, and use Pingdom metrics to judge our success.
We’re going to use three modules to fine-tune our website: Expires, Headers, and Deflate. Using those modules, we will:
- Enable Compression
- Enable Browser Caching
- Disable “.htaccess” Lookup
- Disable DNS Lookups
- Enable and Configure Keepalive
- Enable HTTP/2
First, make sure all three modules are enabled.
a2enmod expires headers deflate The response shows us expires and headers modules are now enabled, and deflate was already enabled.
Enabling module expires.
Enabling module headers.
Considering dependency filter for deflate:
Module filter already enabled
Module deflate already enabled
To activate the new configuration, you need to run:  systemctl restart apache2
Now restart the Apache2 service to apply the new module configurations.
systemctl restart apache2 Enabling Compression
Let’s start with compression. The deflate module is Apache’s compression/decompression module. It compresses the output files, decreasing the number of bytes that need to be transferred to the client. However, while this lowers network bandwidth and drastically reduces load time, be aware it also uses CPU cycles. If your server’s CPU is already highly utilized, compression might affect performance adversely—the opposite of what we’re trying to do! A useful article to read on this topic is Measuring the Performance Effects of mpd_deflate in Apache.
Although compression is enabled by default, the default configuration has limited types enabled. By using the AddOutputFilterByType directive, we can define which MIME types will be compressed.
Let’s update the file:
nano /etc/apache2/sites-available/000-default.conf Paste the following snippet into the file.
 <IfModule mod_deflate.c>

  AddOutputFilterByType DEFLATE application/javascript text/javascript application/x-javascript text/js

  AddOutputFilterByType DEFLATE application/xhtml+xml application/xml text/xml application/rss+xml

  AddOutputFilterByType DEFLATE application/vnd.ms-fontobject

  AddOutputFilterByType DEFLATE application/x-font application/x-font-opentype application/x-font-truetype

  AddOutputFilterByType DEFLATE application/x-font-ttf font/opentype font/otf font/ttf

  AddOutputFilterByType DEFLATE image/x-icon image/svg+xml

  AddOutputFilterByType DEFLATE text/css text/html text/plain

</IfModule>
Now reload Apache to apply the configuration changes.
systemctl reload apache2 Enabling Browser Caching
Next, let’s enable browser caching. Although it doesn’t change the actual loading times of the page, browser caching drastically improves the user experience by indicating which components can be cached in the browser for subsequent requests.
Be aware, however, high cache expires headers, while excellent for the user experience, can cause updated versions of resources to not be used. If this is the case for your deployment, consider a build process to rename the file (timestamp, MD5 hash, etc.), so newer versions of the file are always reloaded.
Here, we’ll configure a default of five days and one month for the below file types. You’ll need to apply the configuration by modifying the expires time according to change frequency and build process.
Go ahead and edit the file:
nano /etc/apache2/sites-available/000-default.conf Paste the following configuration between <VirtualHost *:80></VirtualHost> tags.
<IfModule mod_expires.c>

    ExpiresActive on

    ExpiresDefault "access plus 5 days"

    ExpiresByType text/js "access plus 1 months"

    ExpiresByType text/javascript "access plus 1 months"

    ExpiresByType application/javascript "access plus 1 months"

    ExpiresByType application/x-javascript "access plus 1 months"

    ExpiresByType application/xhtml+xml "access plus 1 months"

    ExpiresByType application/xml "access plus 1 months"

    ExpiresByType text/xml "access plus 1 months"

    ExpiresByType application/rss+xml "access plus 1 months"

    ExpiresByType application/vnd.ms-fontobject "access plus 1 months"

    ExpiresByType application/x-font "access plus 1 months"

    ExpiresByType application/x-font-opentype "access plus 1 months"

    ExpiresByType application/x-font-truetype "access plus 1 months"

    ExpiresByType application/x-font-ttf "access plus 1 months"

    ExpiresByType font/opentype "access plus 1 months"

    ExpiresByType font/otf "access plus 1 months"

    ExpiresByType font/ttf "access plus 1 months"

    ExpiresByType text/css "access plus 1 months"

    ExpiresByType text/html "access plus 1 months"

    ExpiresByType text/plain "access plus 1 months"

    ExpiresByType image/gif "access plus 1 months"

    ExpiresByType image/jpg "access plus 1 months"

    ExpiresByType image/jpeg "access plus 1 months"

    ExpiresByType image/png "access plus 1 months"

    ExpiresByType image/x-icon "access plus 1 months"

    ExpiresByType image/svg+xml "access plus 1 months"

</IfModule>
Disable “.htaccess” Lookup
Apache has a configuration override feature giving you the ability to modify configuration per-directory using the .htaccess file. As these changes don’t require a reload, they can be perfect for operations teams to customize behaviors. By default, Apache looks for a .htaccess file to see if any override configuration exists on each page lookup. However, if you don’t require .htaccess functionality, you should disable the lookup. You can still use the same directives on virtual host configuration.
Edit the file:
nano /etc/apache2/sites-available/000-default.conf Inside the <VirtualHost *:80></VirtualHost>, paste the following to disable the .htaccess file in each lookup.
<Directory />
    AllowOverride none
</Directory>
Disable DNS Lookups
The HostnameLookups directive provides DNS resolution for the IP addresses in the logs. Each time a client makes a request, a DNS request is sent. If you aren’t using the hostname as a reference, you can disable this lookup to increase performance.
Edit the file:
nano /etc/apache2/apache2.conf Find “HostnameLookups” option and make sure it’s “Off.”
HostnameLookups Off Save/exit and reload Apache for the configuration to take effect.
systemctl reload apache2 Enabling and Configuring Keepalive
The Keepalive feature allows HTTP/1.0 clients to use a persistent connection to send multiple requests. This persistent connection reduces the connection time for each request. However, this feature can allow dead connections to remain open, so be sure to use a reasonable timeout value.
Configuring the Keepalive feature is straightforward. After enabling with On, there are two parameters you can configure. MaxKeepAliveRequests determines how many requests can be sent through a KeepAlive connection. KeepAliveTimeout determines how many seconds the server should wait between requests.
In the file:
nano /etc/apache2/apache2.conf Edit these settings:
KeepAlive On
MaxKeepAliveRequests 100
KeepAliveTimeout 5
Reload the Apache service for changes to take effect.
systemctl reload apache2 Enabling HTTP/2
HTTP/2 is the most recent version of the HTTP protocol (HTTP/3 is on its way at the time of this writing). HTTP/2 has greatly improved page load times. Before HTTP/2, components were transferred sequentially over individual connections. Now, transfers rely on a binary protocol supporting multiple requests/responses (called streams) over the same connection. This reduces the time it takes to establish multiple connections to the server and improves the overall network latency. HTTP/2 can also push data before the client asks for it.
Let’s enable http2 module.
a2enmod http2 An output similar to the one below is displayed.
Enabling module http2.
To activate the new configuration, you need to run:  systemctl restart apache2
systemctl restart apache2
Response Headers
Finally, let’s check the response headers to ensure our configurations are correct and Apache is behaving as it should. Use curl command to get request and response headers.
curl -v -s --http2-prior-knowledge -D - -o /dev/null http://localhost Here, we can see we initiate the connection via HTTP/2 protocol and server response is as it should be. We can also see expires headers as well.
*   Trying 127.0.0.1:80...
* TCP_NODELAY set
* Connected to localhost (127.0.0.1) port 80 (#0)
* Using HTTP2, server supports multi-use* Connection state changed (HTTP/2 confirmed)
* Copying HTTP/2 data in stream buffer to connection buffer after upgrade: len=0
* Using Stream ID: 1 (easy handle 0x5631d29067c0)
> GET / HTTP/2
> Host: localhost
> user-agent: curl/7.68.0
> accept: */*
>
* Connection state changed (MAX_CONCURRENT_STREAMS == 100)!
< HTTP/2 200 HTTP/2 200
< date: Fri, 30 Oct 2020 10:56:08 GMT
date: Fri, 30 Oct 2020 10:56:08 GMT
< server: Apache/2.4.41 (Ubuntu)
server: Apache/2.4.41 (Ubuntu)
< x-trace: 2B04C15ED9A7A6B279ED6CD3CD3E1BE84E8FC6AF135355ABF6E97E296201
x-trace: 2B04C15ED9A7A6B279ED6CD3CD3E1BE84E8FC6AF135355ABF6E97E296201
< link: <http://159.65.123.126/index.php/wp-json/>; rel="https://api.w.org/"
link: <http://159.65.123.126/index.php/wp-json/>; rel="https://api.w.org/"
< cache-control: max-age=2592000
cache-control: max-age=2592000
< expires: Sun, 29 Nov 2020 10:56:08 GMT
expires: Sun, 29 Nov 2020 10:56:08 GMT
< vary: Accept-Encoding
vary: Accept-Encoding
< content-type: text/html; charset=UTF-8
content-type: text/html; charset=UTF-8
Observing Improvements With Pingdom
Now let’s use SolarWinds Pingdom to check the improvements our changes have made.
We can see web application’s “Performance grade” (YSlow score) has increased from 83/100 to 92/100. We’ve gone from a B to an A!

We can also see the improvements from the baseline.

In the detail section of this CSS file, we can see a few of our improvements in action. The content encoding is “gzip,” the response headers include the expires header we set, the connection uses Keepalives, and HTTP/2 is enabled.
Conclusion
In this article, we deployed a simple website using Apache and DigitalOcean, then used Pingdom to measure and create a baseline of our site’s speed. We then used the suggestions and measurements from SolarWinds Pingdom to enable a few optimizations on Apache and saw the speed improvements in action. Using Pingdom in combination with Digital Ocean gives teams the perfect way to deploy, scale, and improve our applications.


