


 We know there are around 2.4 billion Internet users in total in the world, but did you ever wonder how many of them that are awake when you are? We did.
For example, if you live in central Europe you share time zone with millions of people in Africa. And if you live in Australia, chances are you check the morning news on your tablet at the same time as many others in Japan.
We did the same study a few years ago. Now we’re back with the latest data, more information, and we hope you will like it.
Time zones: a different way of looking at Internet users
One big reason for doing this type of study is that we find this way of looking at Internet usage across the world refreshing. It offers new perspectives on how we use the Internet and how it develops. Also, in this year’s study we added a lot of information compared to the previous one, which we think adds even more perspective.

Note: The map above is used for orientation; it does not show the exact time zones. You can find a map with the full time zones here and you can click here for a larger version.
Other highlights from the study include:
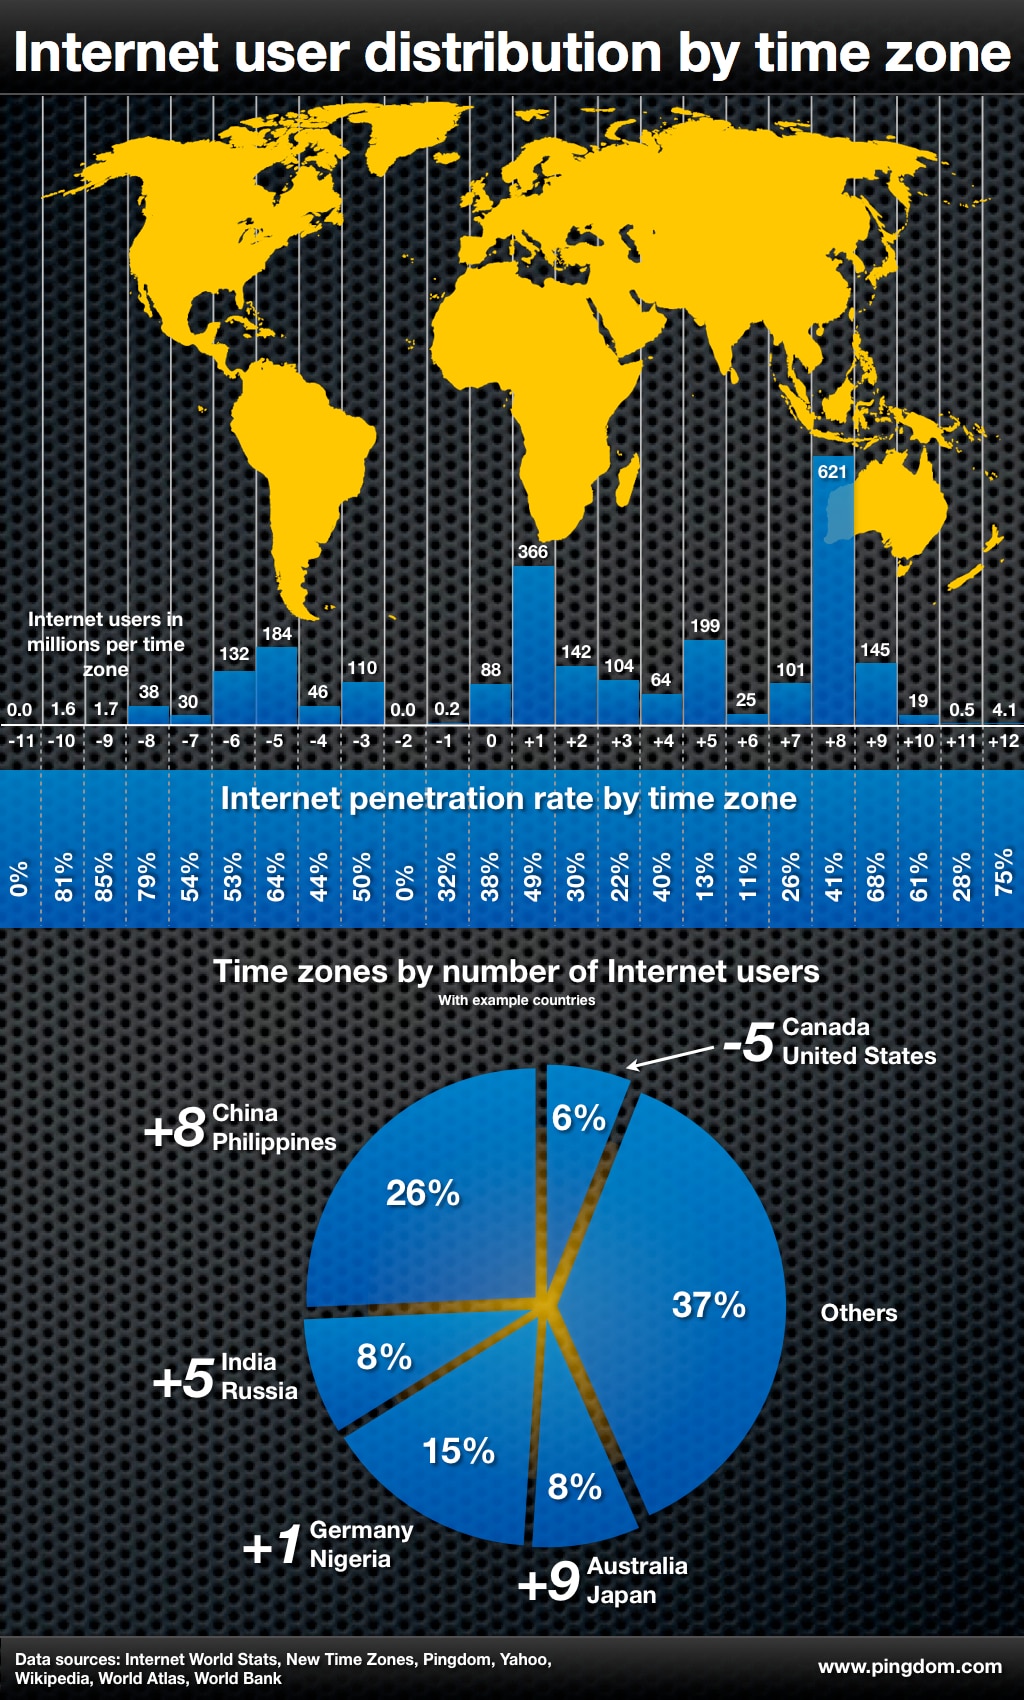
- UTC +8 is the time zone with the most Internet users, and with an Internet penetration of 41% it can only grow in the years to come.
- The largest single contributor worldwide is of course China with 538 million Internet users.
- The average worldwide Internet penetration rate is 34.3%.
- The 68% Internet penetration rate of UTC +9 may seem high, but can be explained by the large populations and high Internet penetration rates of Japan and South Korea.
- Internet penetration of UTC +1 is very unevenly distributed with low numbers like 5% in Cameroon and high, for example 92% in Norway.
- 10 of the time zones pass the 100 million mark in Internet users, UTC -6, -5, -3, +1, +2, +3, +5, +7, +8 and +9.
- Nigeria, with an Internet penetration of 30%, is the third largest contributor in UTC +1 with 48 millions Internet users. Only France (52 million) and Germany (67 million) have more Internet users in that time zone.
- The smallest contributor worldwide is Southern Sudan with 100 Internet users, followed by Christmas Island with 464 Internet users.
Internet usage shifts eastward
The obvious conclusion from this is of course that the greatest number of potential new Internet users lie in the east, in timezones UTC +5 to +9. Combine that with the fact that China already rules the Internet as the country with the most users online, and you arguably have an interesting situation for the coming years.
But in addition to that there are some interesting things to learn. A little more than 40% of all the Internet users can be found in just two time zones, UTC +8 and UTC +1. And just as the east will continue to grow in terms of users, Africa and South America will as well, adding to the total in the time zones they cover.
We will return next year again with an updated study. What do you think the main themes of it will be? Leave a comment below or on Twitter. We’d love to hear what your thoughts are.
How the numbers where put together: Basically, we just divided the world according to the time zones and Internet users. Unfortunately, several countries are divided into more than one time zone. We tried to be as precise as possible in dividing the population of these countries into the different time zones. For some countries the data where already public and for the others we made the calculations on our own. To make our visualization as clear as possible, we just used the time zones of whole hours. The countries that use half hour, or even fifteen minutes, were put in the closest full hour time zone. Finally there are some small Islands in the Pacific Ocean that uses the time zones UTC +13 and UTC +14 and we have not forgot about them but the data is not included in our chart.
Data sources: Wikipedia was a great help for time zone information. Internet user numbers per country came from Internet World Stats. Population divided by time zone came from Newtimezones.com (PDF), Yahoo Answers, Wikipedia, World Bank, and Worldatlas.com.


