


In the first post of this two-part series, we talked about the need to fully understand how users experience your website. Without understanding how your end users interact with your site’s pages—what’s working for them and what’s not—you’d be optimizing on a hunch without solid data to guide you.
To address this, we saw how real user monitoring (RUM) from SolarWinds® Pingdom® can be used with a WordPress site, offering valuable information to analyze site performance and usage data.
In this post, we’re going to dive a bit deeper. Let’s see how we can filter our RUM data to better understand, anticipate, and reach the site’s target audience.
The Need to Identify Your Site’s Target Audience
There are many reasons you need to identify your site’s target audience. First and foremost, you need to know who your audience is to be effective in reaching them with your product, service, message, or cause. Sometimes, this audience varies.
For example, an online booking website (selling tickets worldwide) may want to target visitors from a particular geographic region for an upcoming event near them. Similarly, if you’re trying to build awareness among young adults about alcohol abuse, you’ll want to identify an age range for the visitors or a common device type people of that age range predominantly use.
How Pingdom Can Help Reach Your Target Audience
There are a few ways Pingdom can help you better understand your site’s visitors and reach them for higher conversion.
Segmenting Geolocation by Load Time
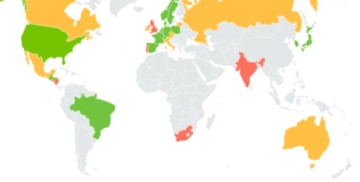
As you saw in the first part of this series, Pingdom RUM can display data based on geography, device, browser, or various other measures. This can make it easy to identify and resolve problems impacting one specific user segment. Better yet, RUM can help you catch trends before they become problems.
One example of where you can use such data to reach your target audience is by filtering page load times by geolocation. Let’s return to our global ticketing website use case. If you were selling tickets for the Australian Open tennis tournament, for example, you’d want to ensure the load times in the Asia-Pacific region—particularly Australia and New Zealand—are fast and meet a certain service-level agreement (SLA). If the average load times of the relevant pages in these countries were slower than other places around the world or the SLA, you could think about using a content delivery network (CDN) closer to your target location to better serve the home crowd.
The Apdex Score
The Application Performance Index (Apdex) score is a widely adopted standard measuring user satisfaction (or dissatisfaction) regarding a website’s response time. It’s a simple way to “measure what matters” in the context of user satisfaction, and it’s ultimately expressed as a number. The number is composed by first adding the total number of users whose load times were “satisfactory,” half the number of users whose load times were tolerable, and none of the users who experienced frustration. Next, this sum is divided by the total user count, resulting in a number between 0 and 1, where 1 represents a perfectly satisfactory experience for all users.
The response time for the Apdex score is measured from the moment a user requests a resource to the moment it’s delivered back. The satisfaction level is measured by comparing the resource’s response time against a threshold.
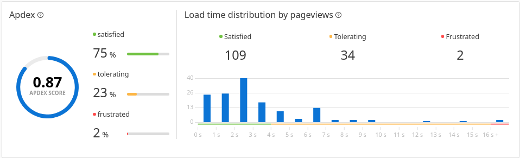
The Pingdom RUM Details page can show the Apdex score for your site. In our ticketing system example, we can segment the data to show the Asia-Pacific region only, and then we can check the Apdex score once a CDN is used.
Segmenting Users by Transaction Rate
Similarly, if your WordPress site (or any CMS-powered site monitored by Pingdom) shows a high rate of transactions on a particular landing page, it may mean the page is popular among visitors. Equipped with this knowledge, you could target a specific demographic, region, or subset of signed-up users.
For example, your site may have recently published a cybersecurity threat report for ransomware, and you may see many B2B customers signing up with their corporate emails to download the report. Not only can you further fine-tune the page to ensure smooth loading—you can also put links to your previously published reports. Doing so will also help you grow your email list.
Using Transaction Monitoring
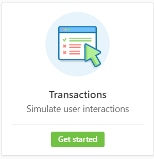
To ensure your critical landing page is performing as expected, you can also create a transaction monitoring check. Such transactions could be clicking a link, filling in a form, checking out a shopping cart, downloading a file, and so on. Transaction monitoring can simulate the interactive events of the transaction and capture any failures.
You can begin the process by clicking the Transactions (Simulate user interactions) link from the main dashboard in Pingdom.
On the next page, click the Add check button to open the Add Transaction Check dialog:
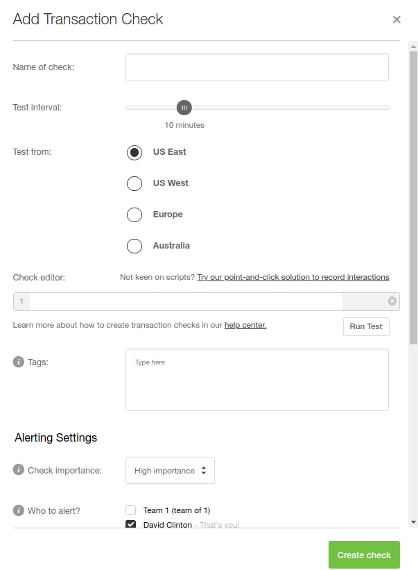
Here, you can provide settings, including a name for the check, test frequency, and the geographic location from where the test should be performed.
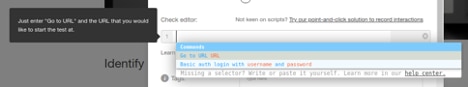
The most important field in this dialog is the Check editor. This is where you can either enter a script or let Pingdom help you build one with the no-code recorder. The script tells Pingdom to perform the exact steps a user would perform to complete the transaction.
Creating the transaction check involves specifying the page URL, any login information, the actions a user should take, and the responses that should be returned.
Segmenting Users by Device Type
Like high-transaction webpages, recurring trends in outages and poor-performing pages can present opportunities for reaching existing and new audiences. Drilling down into the poorly performing parts of your website can reveal the need for improvement in site design for specific device types.
Let’s go back to our alcohol abuse awareness website for young adults. If you see a consistent trend showing a poor user experience and bounce rate in mobile devices, you may want to ensure the site is optimized for mobile devices and browsers. This is because you can assume most of the people in your target age range would be using their mobile devices to surf the web. Similarly, you’ll want the same performance for PC-based browsers, as this is what most parents or guardians use. Based on these premises, you may decide to use a specific WordPress template offering optimal performance for both device types.
Segmenting Users With Page Groups
Larger websites can have hundreds or even thousands of pages, with many pages generated dynamically based on user activity such as sign-ups or purchases. You may be more interested in these conversion-oriented pages rather than the generic landing pages. The Pingdom page groups feature makes it easy to restrict your data display to a preset range of pages. This can give your data a new meaning, as it’ll show how users are converting (or not converting) and help you reach out to them.
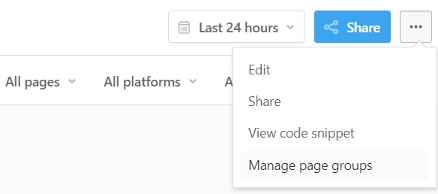
You can create a new page group by clicking the ellipses button at the top right of the RUM Details page for your site in Pingdom and then selecting the Manage page groups item.
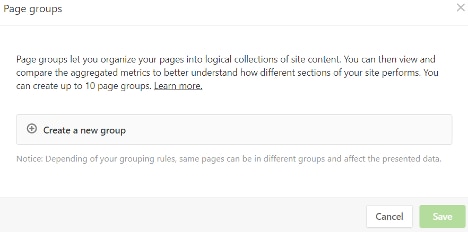
Next, in the Create a new group dialog box, click the Create a new group link:
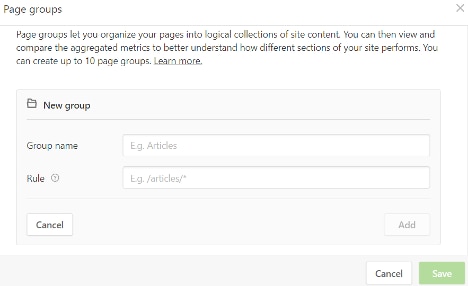
This will prompt you to enter an easily identifiable group name and a rule. The rule will describe exactly which pages you’d like to include in the group.
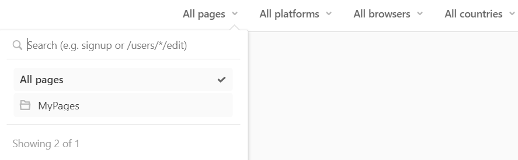
It’s easy to tell Pingdom to focus just on the pages from your newly created page group. From the site’s RUM Details page, click the All pages drop-down and select the page group. In the image below, we can see one such page group called MyPages:
Segmenting Users With Date Range
The Pingdom RUM Details page includes a handful of tiles showing key data. The highlighted information includes the following:
- Current active sessions
- Current load time
- Current Apdex score
- Current bounce rate
- Load time by geography, platform, browser, or page
- Pageviews during each 10-minute interval
- Average active sessions during each 10-minute interval
- Media load time and exit rate for each page
The data can be filtered by date range, page groups, platforms, browsers, and countries. In general, choosing a higher-traffic date range can help distinguish user behavior.
For example, let’s say you’re running a campaign where users can download a product from your site for free, but only for a weekend. Once the campaign is over, you check back and see a figure the like the one below:
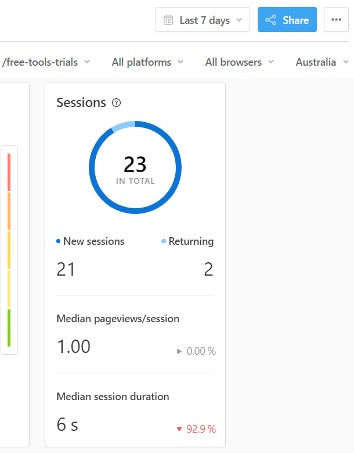
We can see there are some new visitors and only a few returning users. The overall session duration has decreased. (This is likely because the users realize the product isn’t free anymore.) You may want to rerun the campaign or reach out to the returning users from this region (Australia) with offers of paid after-download services.
Conclusion
Thoughtful use of the available filters in Pingdom can be a powerful tool for user segmentation and understanding user behavior. Ultimately, this means more focused targeting of the audience you’re trying to reach. Once you’ve identified your target audience groups and observed their behaviors, you can take several steps to reach them more effectively. This includes creating a more responsive website, providing specific types of content, designing simpler user interfaces, and so on. These, in turn, will lead to greater customer engagement, a higher conversion rate, and a reduced bounce rate.
To take your WordPress (or other CMS-powered) site one step closer to your audience, sign up for a 30-day free trial of Pingdom.


