


Many factors have led to the massive increase of online retail sales in 2020 and 2021, including the increasing reliance of online activities from COVID-19. To put the growth into perspective: in 2017 when we last reported on web performance for the world’s leading retail sites, the industry generated around $2.2 trillion in revenue. In 2021, global e-commerce sales are expected to hit $4.921 trillion. Even more pressing for e-commerce sites, is the pressure the sell this volume heavily in the last several weeks of the year—especially around Cyber Monday. While “cyber week” reigns king in the United States (with spending increasing 15.1% YoY in 2020), many other countries including United Kingdom, Australia, Canada, New Zealand, and China have reported increases in online shopping to “celebrate” Cyber Monday.
The pressure to sell, specifically online, is on. But with so much that can hurt potential sales (specifically a three-second or higher load speed), we wanted to analyze the performance of the top 50 ecommerce/retail sites before the holiday shopping rush officially kicks off. What sites are ready? Check out the results below.
The Data and How We Tested Web Performance
We compiled a list of the top 50 e-commerce sites based traffic, according to traffic authority Similar Web.
We then tested each page from our nearest test location to provide the optimal load time for each site. Our Page Speed Monitoring tool tested each website every 30 minutes for a week between October 22 and October 29, 2021. Unfortunately, upon collecting our results, one site was incorrectly added, bringing our 50 site total to 49 for analysis. Finally, all results displayed are the average across the time period.
Additionally, tests were performed on desktop versions of each site only.
Benchmarks
With revenue of online retail sales doubling since 2017, let’s see how performance has improved since then as well. The average stats from our 2017 analysis were:
- Average homepage size: 3.03MB
- Average homepage load time: 2.51 seconds (we love to see under three seconds)
- Average number of requests: 192 requests
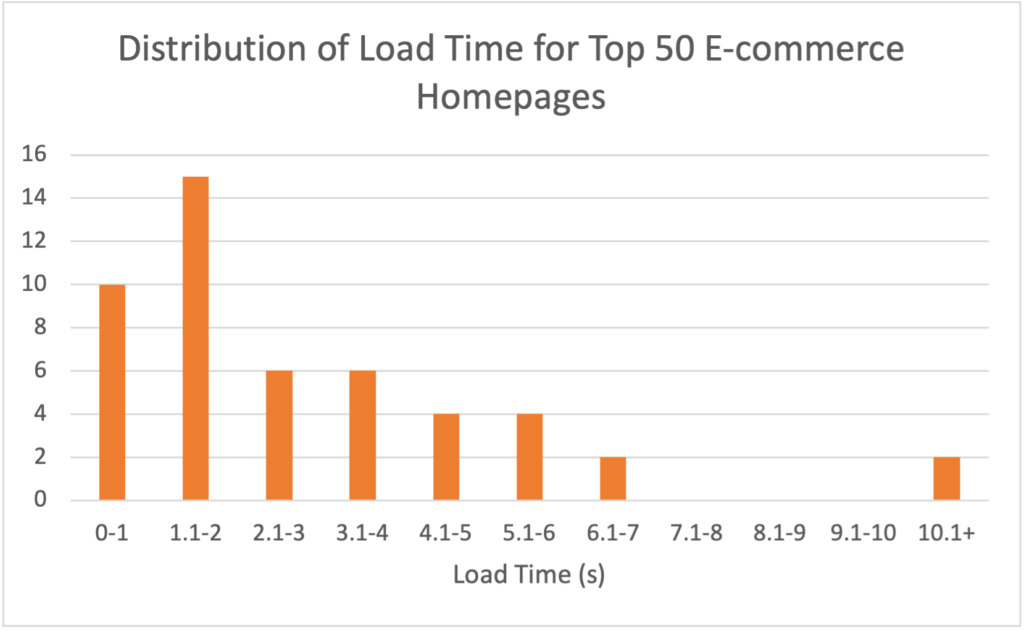
59% of Retail Homepages Loaded in Three Seconds or Less
Speed—whether it’s desktop or mobile—could have a direct impact on your bounce rate (and therefore your sales). While the average load time has increased to 2.87 seconds since our last post, so have the possibilities for user experience and web design.
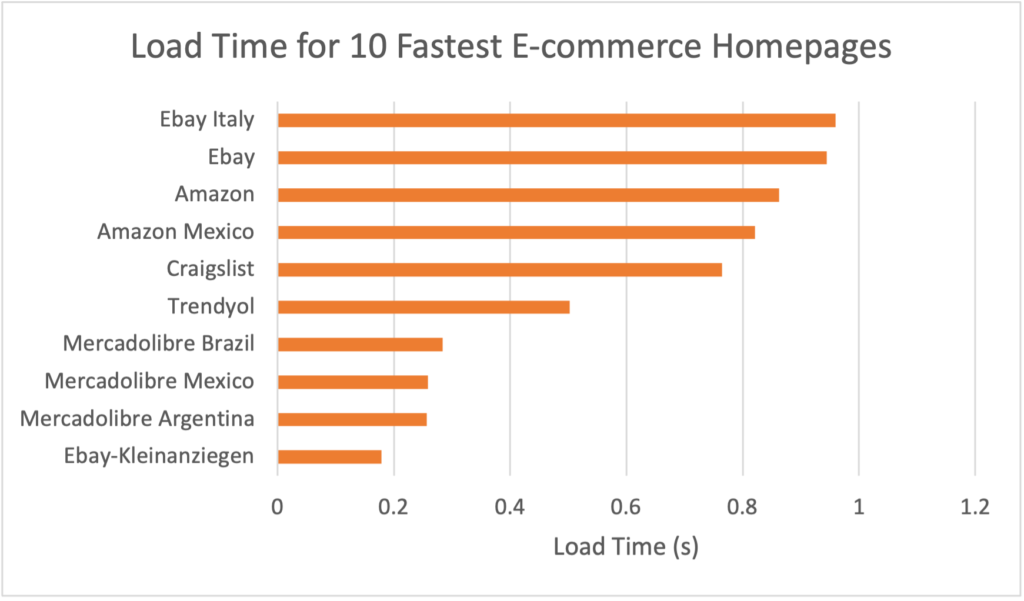
Fastest 10 Retail Homepages
The fastest sites in our tests are quick. eBay-Kleinanziegen clocked an average load time of 0.179 seconds. The United States’ version of eBay also made the fastest 10, averaging 0.944 seconds.
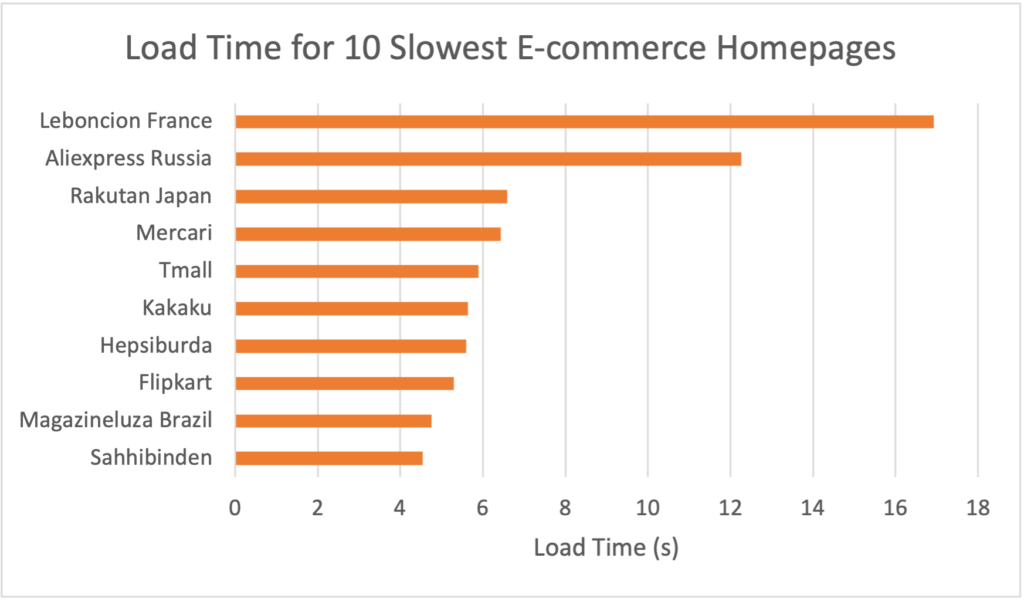
Slowest 10 Retail Homepages
While we’ve seen a worse distribution of load times for the bottom 10 in our page speed testing, none of these sites meet the recommended three-second threshold. While Leboncion France might have some good deals, would you wait 17 seconds of a single page to fully load?
Retail Homepage Size Varied From 0.018MB to 18.63MB
Page speed can be impacted by several factors, including page size. If elements on a page aren’t optimized, it could be worth reviewing downsizing. But since our 2017 tests, homepage sizes have only grown to an average of 3.43MB.
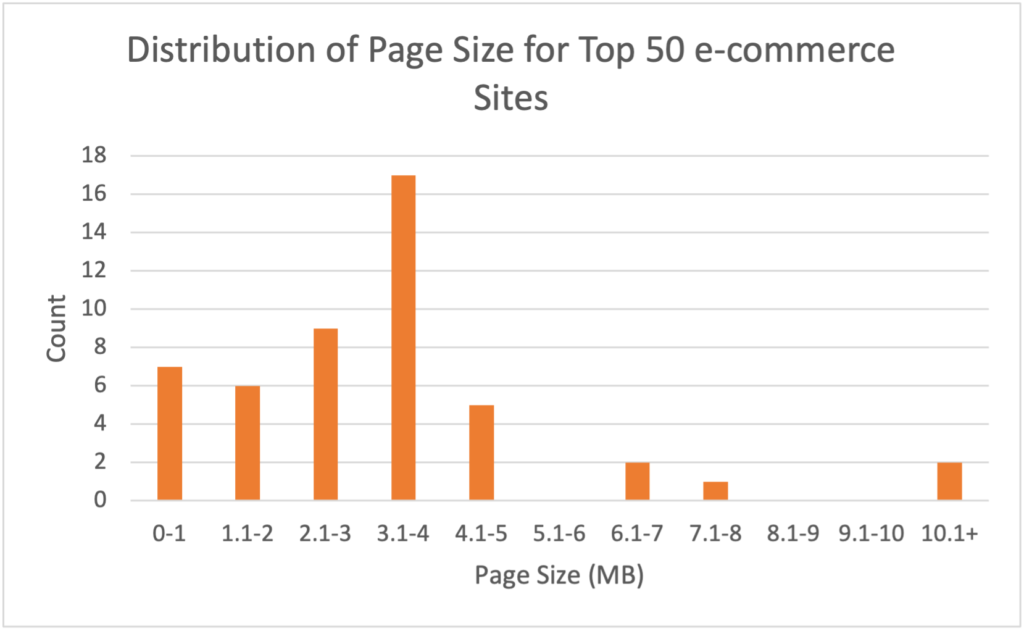
However, don’t let a large page size fool you. Our largest homepage—Wayfair, weighing in at 18.63MB—still sat comfortably under the three second threshold at 2.26 seconds. Next, let’s dive into the correlation between requests and page load.
The Average Request Count Was 174
Only three sites from our tests had more than 300 requests, which is great for speed optimization. Why? Because everything on each of these homepages relies on requests like JavaScript, CSS files, images, videos, etc.
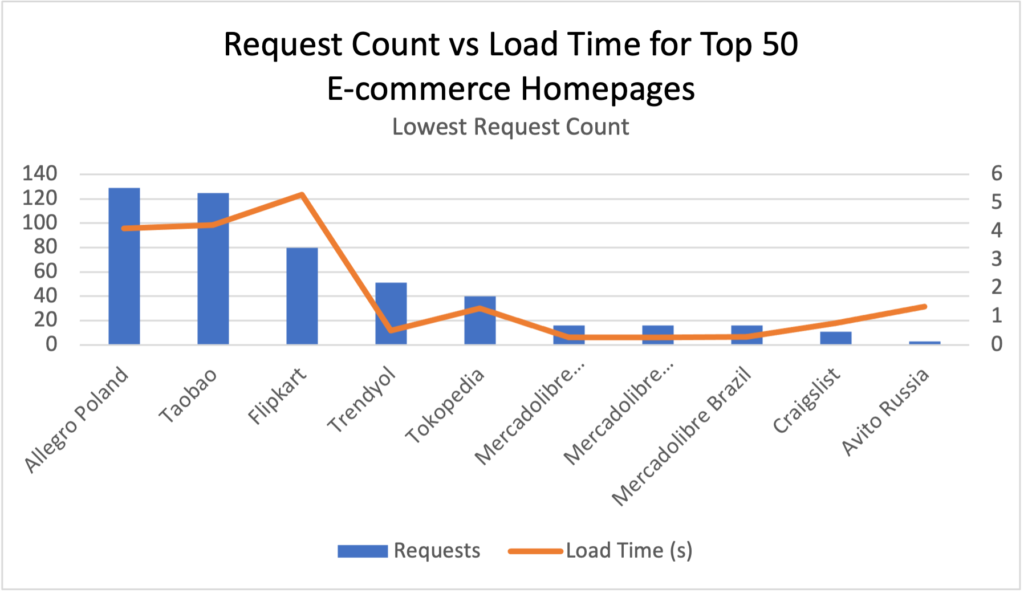
The Fewest Requests vs Load Time
Avito, a Russian site, surprised us by tracking only three requests, but was still one of the slower loading sites (1.32 seconds) with the lowest number of requests. Comparatively, Craigslist had 11 requests and loaded in 0.764 seconds.
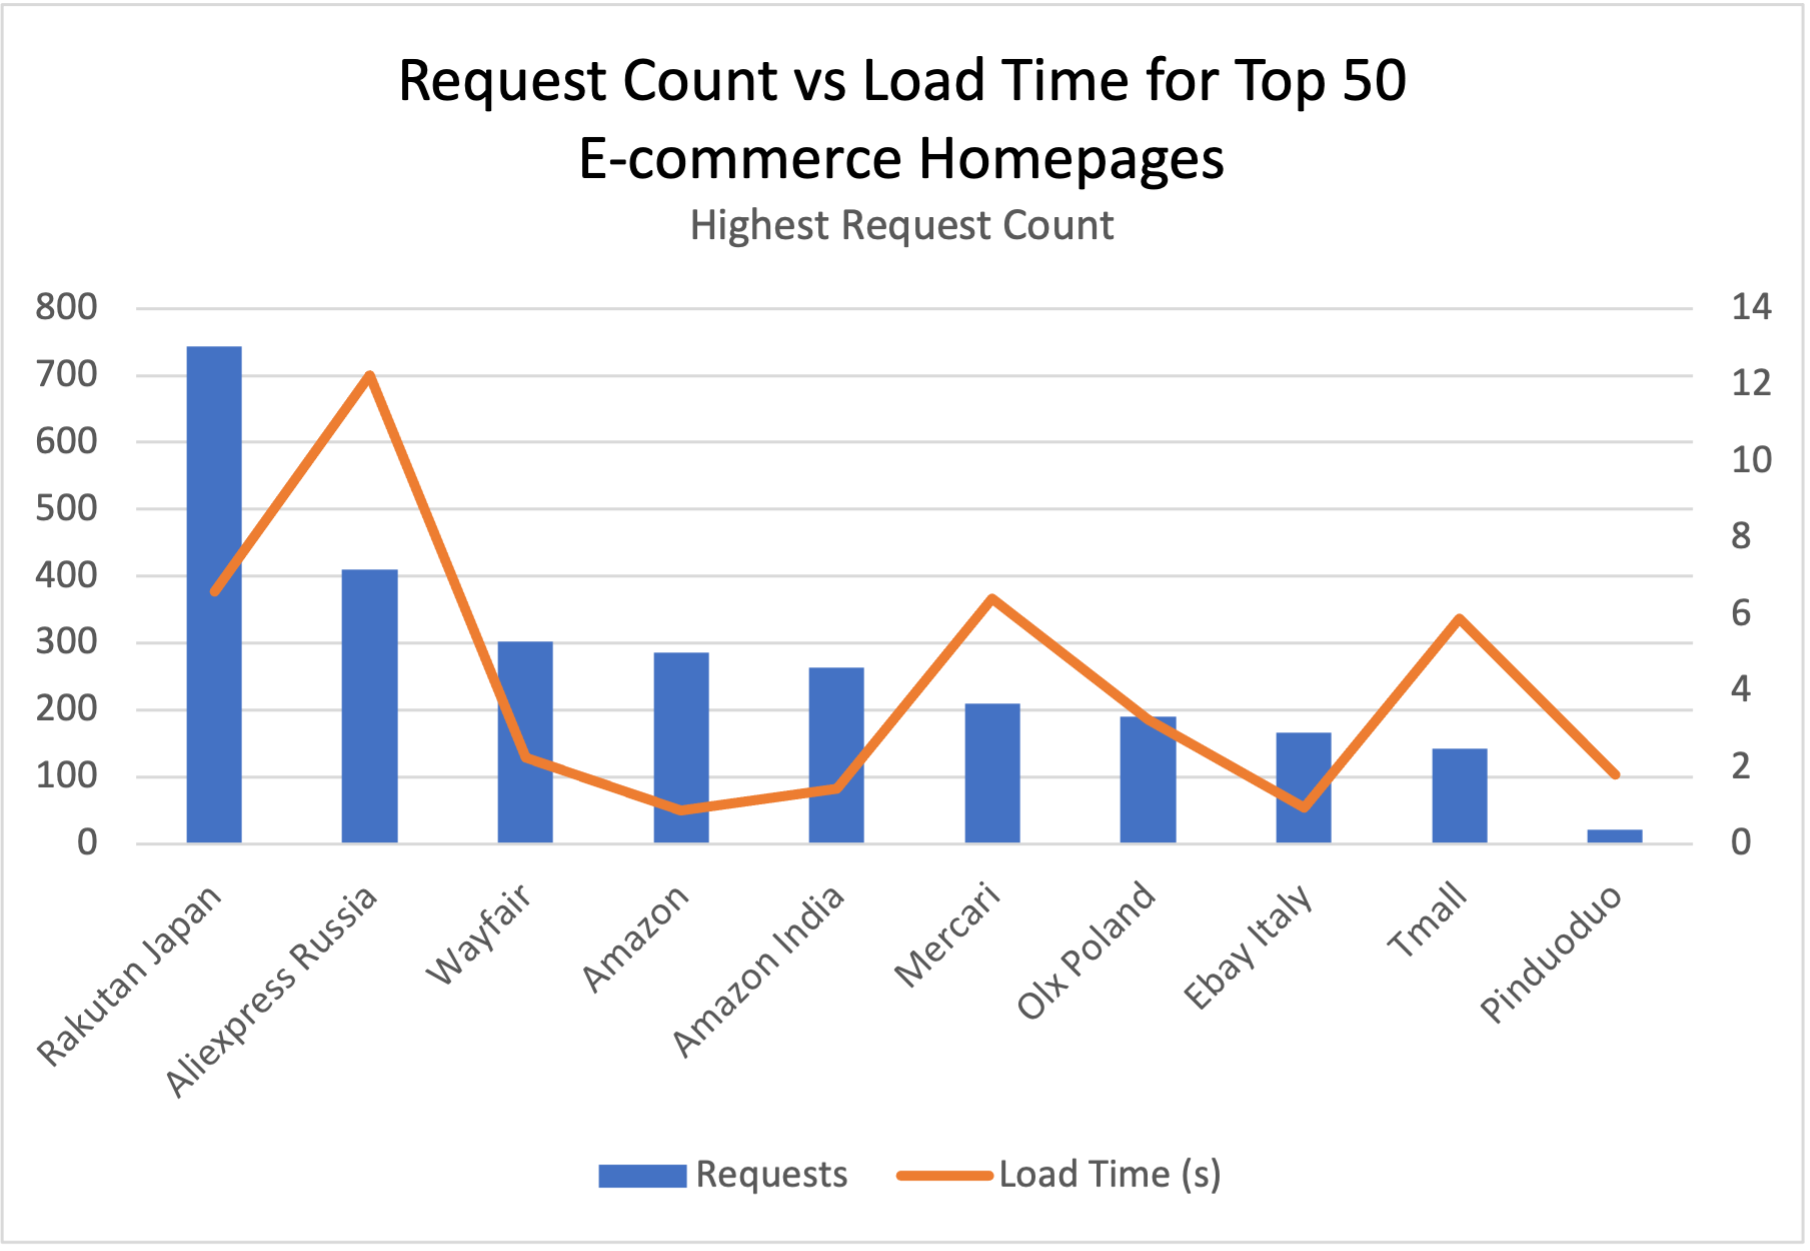
The most requests vs. load time
Half of the sites with the most requests still loaded in under three seconds, showing the work they have done to optimize their requests. The fastest of these sites, Amazon, loaded in 0.863 seconds with 286 requests. Imagine what the load time for Avito would have been with that many requests.

Amazon Reigns Over the Top 50 E-commerce/Retail Sites
Speaking of Amazon, let’s take a deeper look at the hold the giant has over e-commerce and online retail. Out of the 50 sites we started with, 11 of them were Amazon (each a different country’s domain). Not only did Amazon’s site’s rank well enough to be a part of the top 50 sites we tested, but they performed exceptionally well. Each of the 11 sites received an “A” rating and averaged:
Load Time: 1.175 seconds
Page Size: 3.902 MB
Requests: 242
Non-numerically, this means Amazon homepages have more requests and larger homepage sizes with less half than of the load time.
Space to Improve Web Performance Before Cyber Monday
With this in mind, it’s critical e-commerce and retail sites are built for success and constantly monitored for slow pages and unavailability. One thing this dataset makes clear for us: there’s a lot of room for optimization for online retail sites.
Please run your site through our website speed test and see how it compares with the benchmarks mentioned here. You can run an automated performance test every 30 minutes on our dashboard when you sign up for a free 30-day trial as well.


