


We’ve just come back from Velocity conference in Amsterdam and needless to say, it’s been a blast! We thought we’d share with you three of the most interesting bits we took home from the world’s biggest conference for Web performance:
Performance matters, but it’s how your users perceive it that counts most.
At Pingdom, we know that speed really is king when it comes to web performance, but Denys Mishunov made a great point that usually your visitors don’t care how about how the number of requests your site makes when loading, or how many kilobytes you’ve managed to shave off by keeping your CSS and JS merged and compressed. It’s really all about how your visitors perceive load time on your site that counts.
Essentially, sometimes users expect a process to take several seconds to get the feeling that, for example, a search is exceptionally thorough while at other times, anticipate an instantaneous response for your site, to feel that their action was instinctive.
Performance is not about mathematics. Performance is about perception. Perception is what makes a site with very few requests nevertheless feel slow, while a site that delivers search results during tens of seconds can feel fast enough for your user. User’s perception of your website’s speed is the only true performance measure.
You can read more about Denys’ approach to performance here.
Owning your reliability
Adam Surák made gave some really good points in his talk about owning the reliability of your service. He really drove it home that all systems fail – it’s just a question of when and how often this happens and most importantly, how quickly you can turn downtime around.
Monitoring your suppliers is crucial because when their service goes down, it’s your users that complain. Often seen as a ‘silver bullet’, even cloud solutions fail so if hitting that 100% uptime SLA is important to you (which it should be!) then it’s wise to have some redundancy. A good start is having at least 2 DNS providers. You know, just in case one suffers a massive DDoS attack.
Stress testing your system is also a good idea – that way you know exactly how your system holds up when the going gets tough. Happily, Surak did also mention that monitoring your suppliers with 3rd party systems is a great start to ‘owning your reliability on the web’, even mentioning yours truly – we <3 you too Adam!
Humans like graphs more than tables
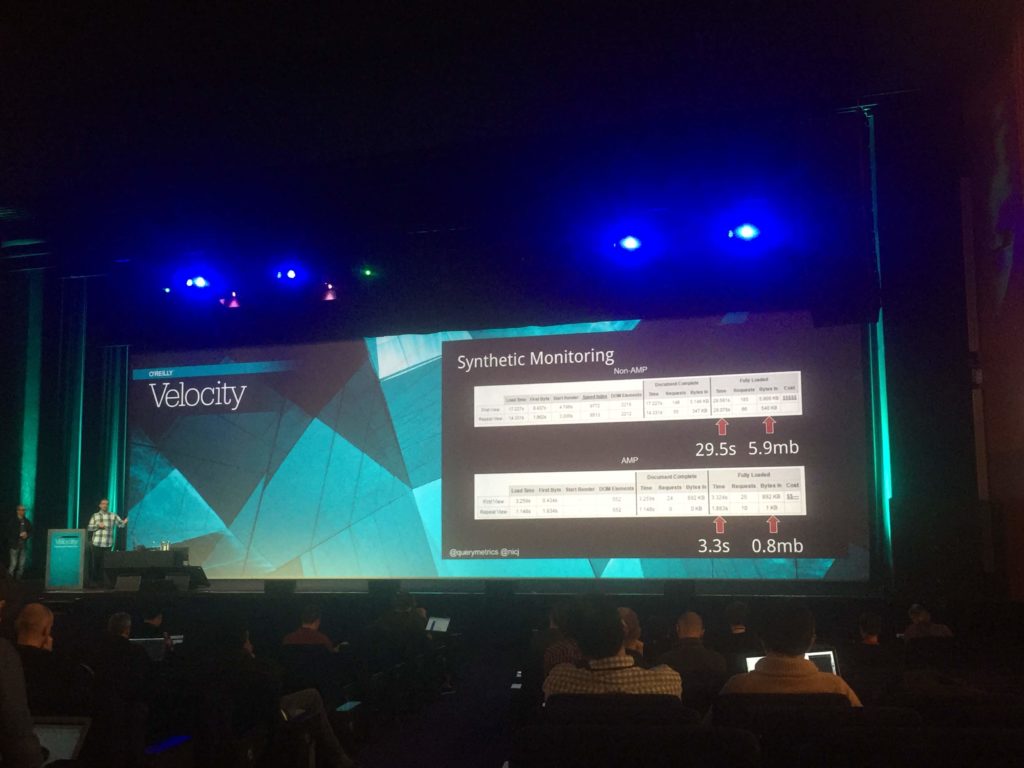
John Rauser made a really good point about helping your customers to digest data more efficiently by making sure that you visualize it properly. This talk was really useful to us, as the one thing we love is graphs!
If you’re like us, you probably look at a lot of data on a daily basis then you work best with it when it is presented optimally. Essentially, graphs present grouped data much more efficiently than tables, so if you really want your users to understand what you’re presenting, put it in a graph and whatever you do, don’t present it as a piechart.
“Piecharts are the information visualization equivalent of a roofing hammer to the frontal lobe. They have no place in the world of grownups and occupy the same semiotic space as short pants, a runny nose, and chocolate smeared on one’s face.” – John Rauser
In reality, every talk we attended was useful and interesting and we could sit here and wax lyrical about the entire three days we spent at Velocity, and that’s not even mentioning all the nice folks we met there either! We’ll leave you with one bonus take-home: if you’re into web performance, get yourself to Velocity next year! We’ll see you there…


