


We took a look at the web performance of the top 50 news sites to learn how many 3rd party trackers are being used, and what it does for the web performance.
- Average load time for the top 50 sites was 9.46 seconds with trackers loading, and 2.69 seconds without.
- Across all the sites tested, we identified 298 different trackers, 225 of which deliver on-site advertising.
- News sites averaged 41 trackers per site.
Managing the performance of the world’s news sites is never an easy task. We rely on them to keep ourselves informed of current issues around the world, to check the weather, to read up on movie and book reviews, and well, pretty much anything.
With internet penetration reaching well over 80% for North America and Europe, we are becoming ever more reliant on our favorite news sites to deliver information as it happens. In fact, a recent survey from the Pew Research Center shows that 38% of Americans consume news from websites exclusively.
Page speed and performance is arguably more important for news sites than any other type of site on the Internet today. We tested the top 50 news websites according to Alexa to see how they performed compared to our performance benchmarks. You can find all of our results in this PDF document.
The average number of tags increases the average page load time by 6.77 seconds
The average news site loads at a snail’s pace
We pulled the list of top 50 news websites from Alexa and ran them through our Page Speed Test. Surprisingly, for an industry where speed is key to delivering news quickly, the average load time of all the sites was 9.46 seconds.
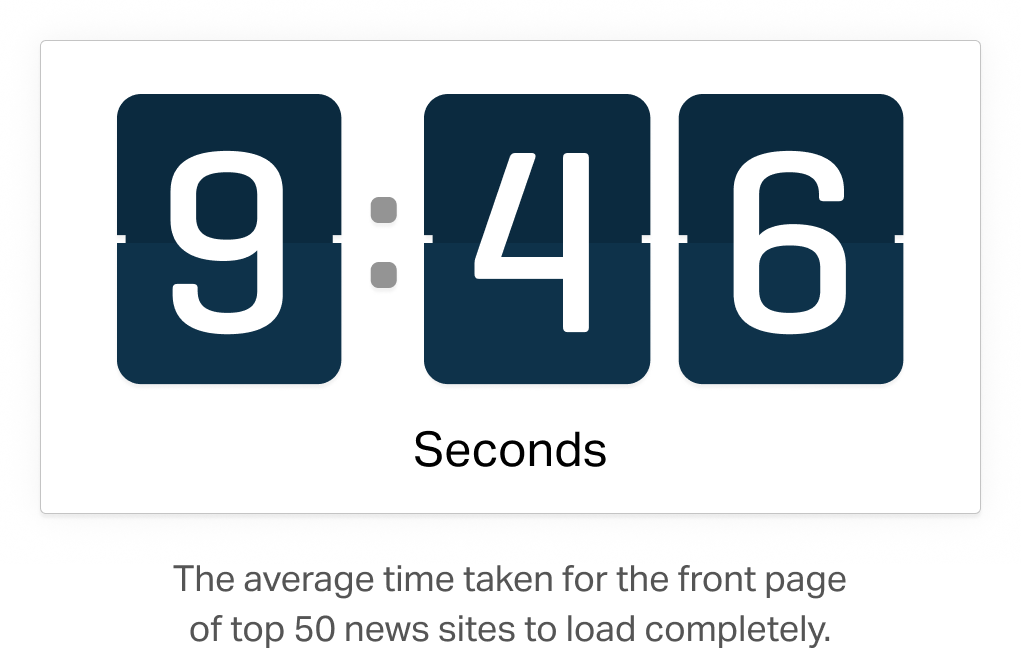
If we compare this load time to that in Google’s Site Performance for Webmasters video, where Maile Ohye, states that “2 seconds is the threshold for e-commerce website acceptability” the top 50 news websites fall significantly behind.
We decided to take a deeper look at what could be causing the significant slowdown in load time for these websites, and in the source codes for many, the culprit was hidden in plain sight: website trackers.
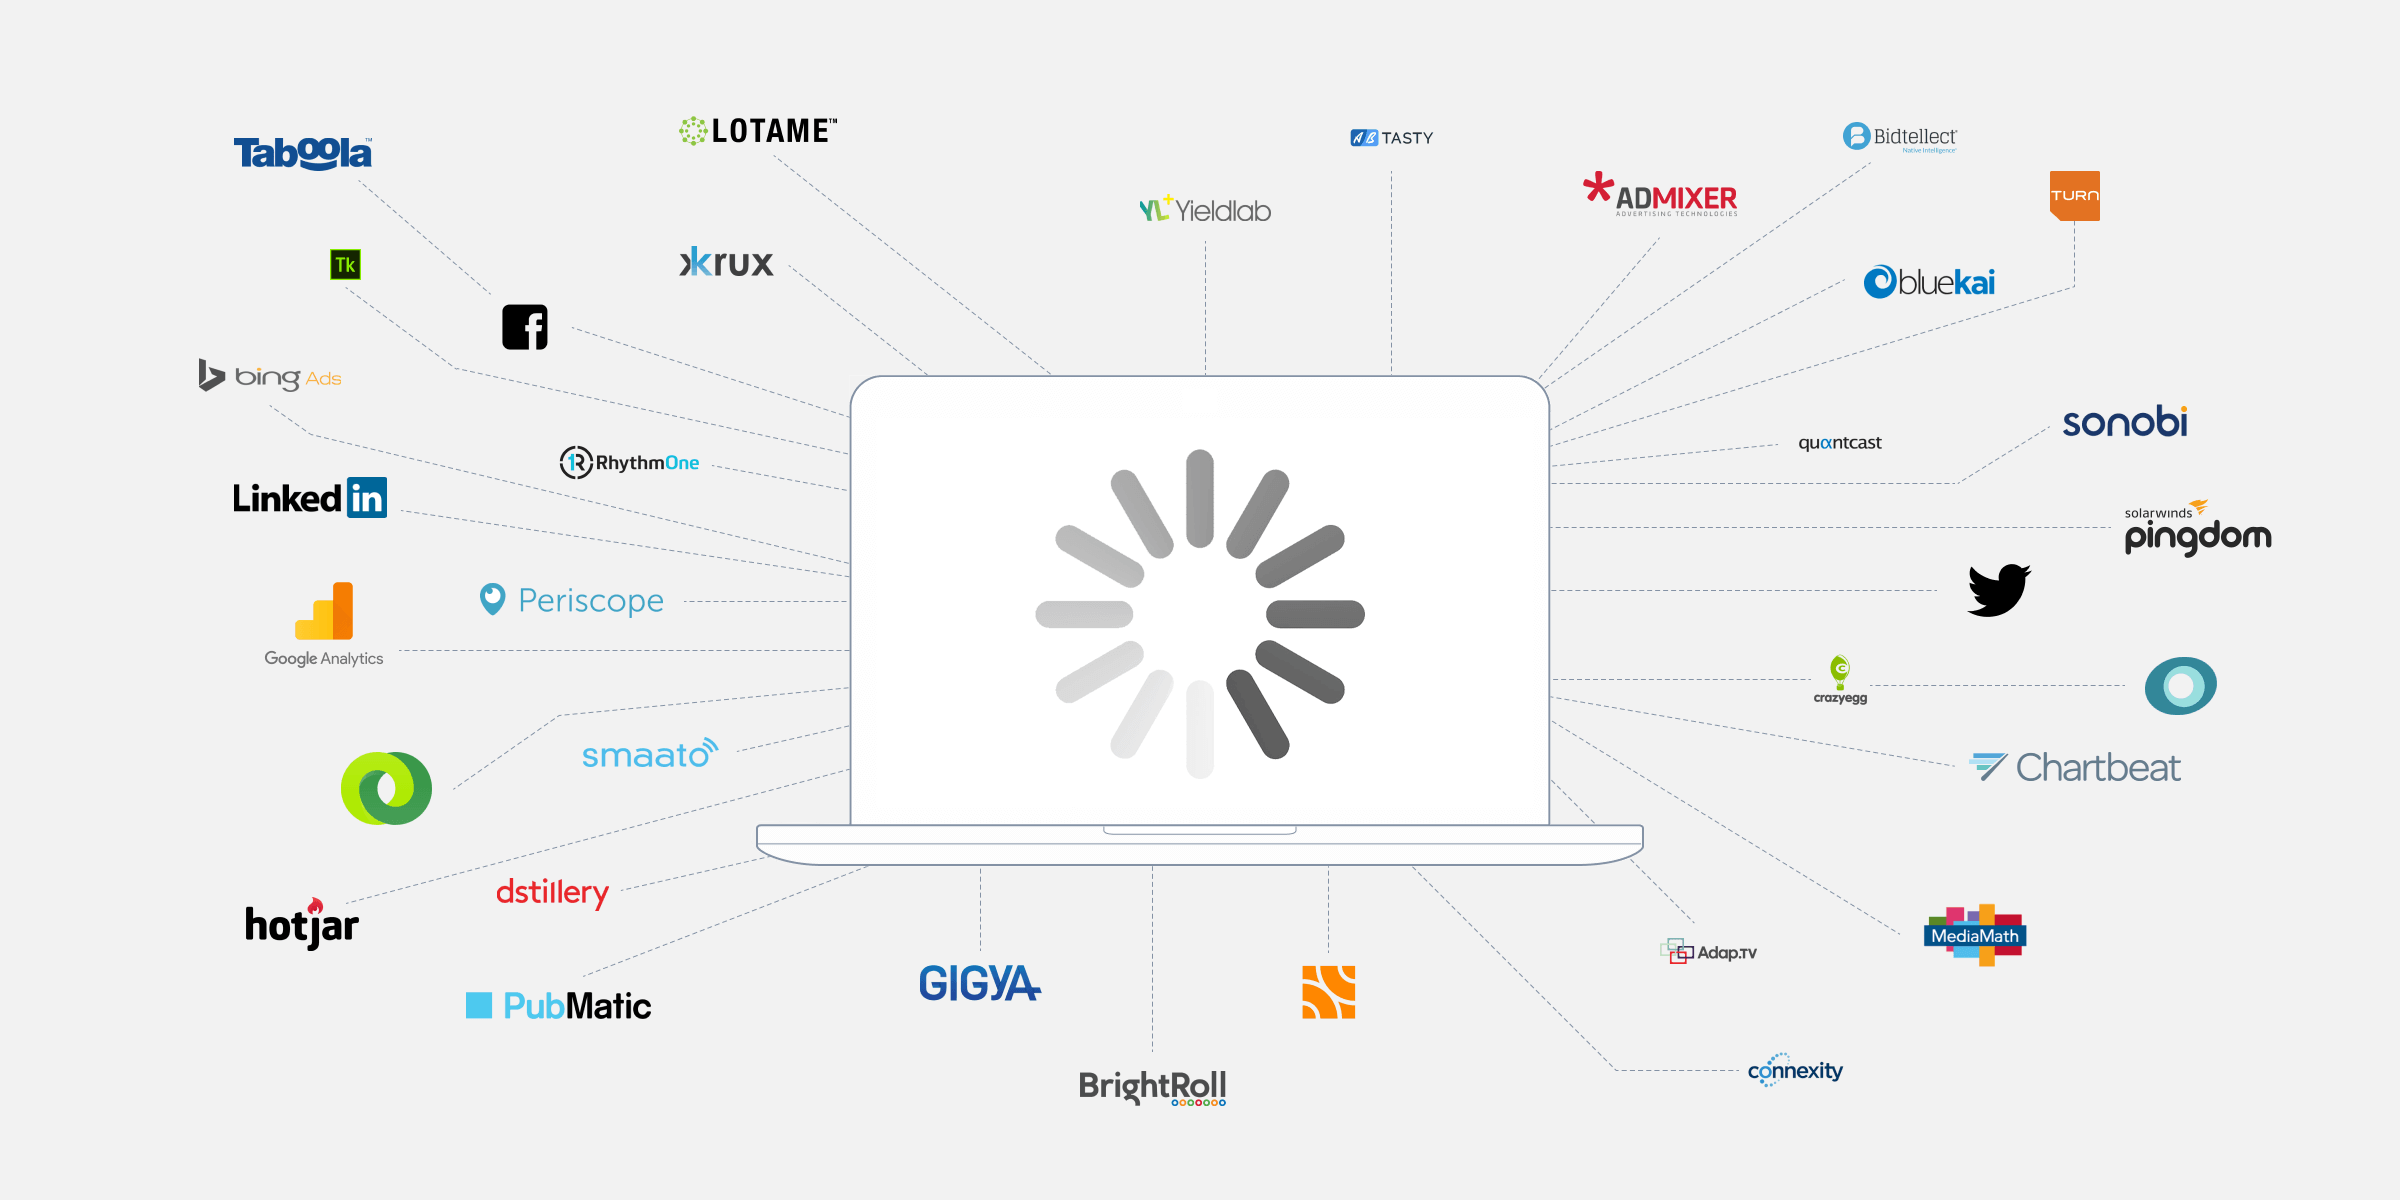
Tags, trackers, beacons, and pixels
Call them what you will, trackers are small snippets of code implemented on websites to serve several purposes: they can track a user’s behavior as they browse your website, help visitors share things on their favorite social media network, and deliver advertising.
To understand how these trackers affected the performance of the top 50 news sites, we used the browser plugin from Ghostery to see how many and what type of trackers loaded on the homepage of each site. For a future blog post, it would be very interesting to see how websites perform with and without trackers using built-in tracking protection such as Firefox, Brave, and others emerging with this feature.
The majority of tracker tags deliver banner adverts
An overwhelming 82% of trackers served to deliver targeted adverts based on a user’s browsing history.
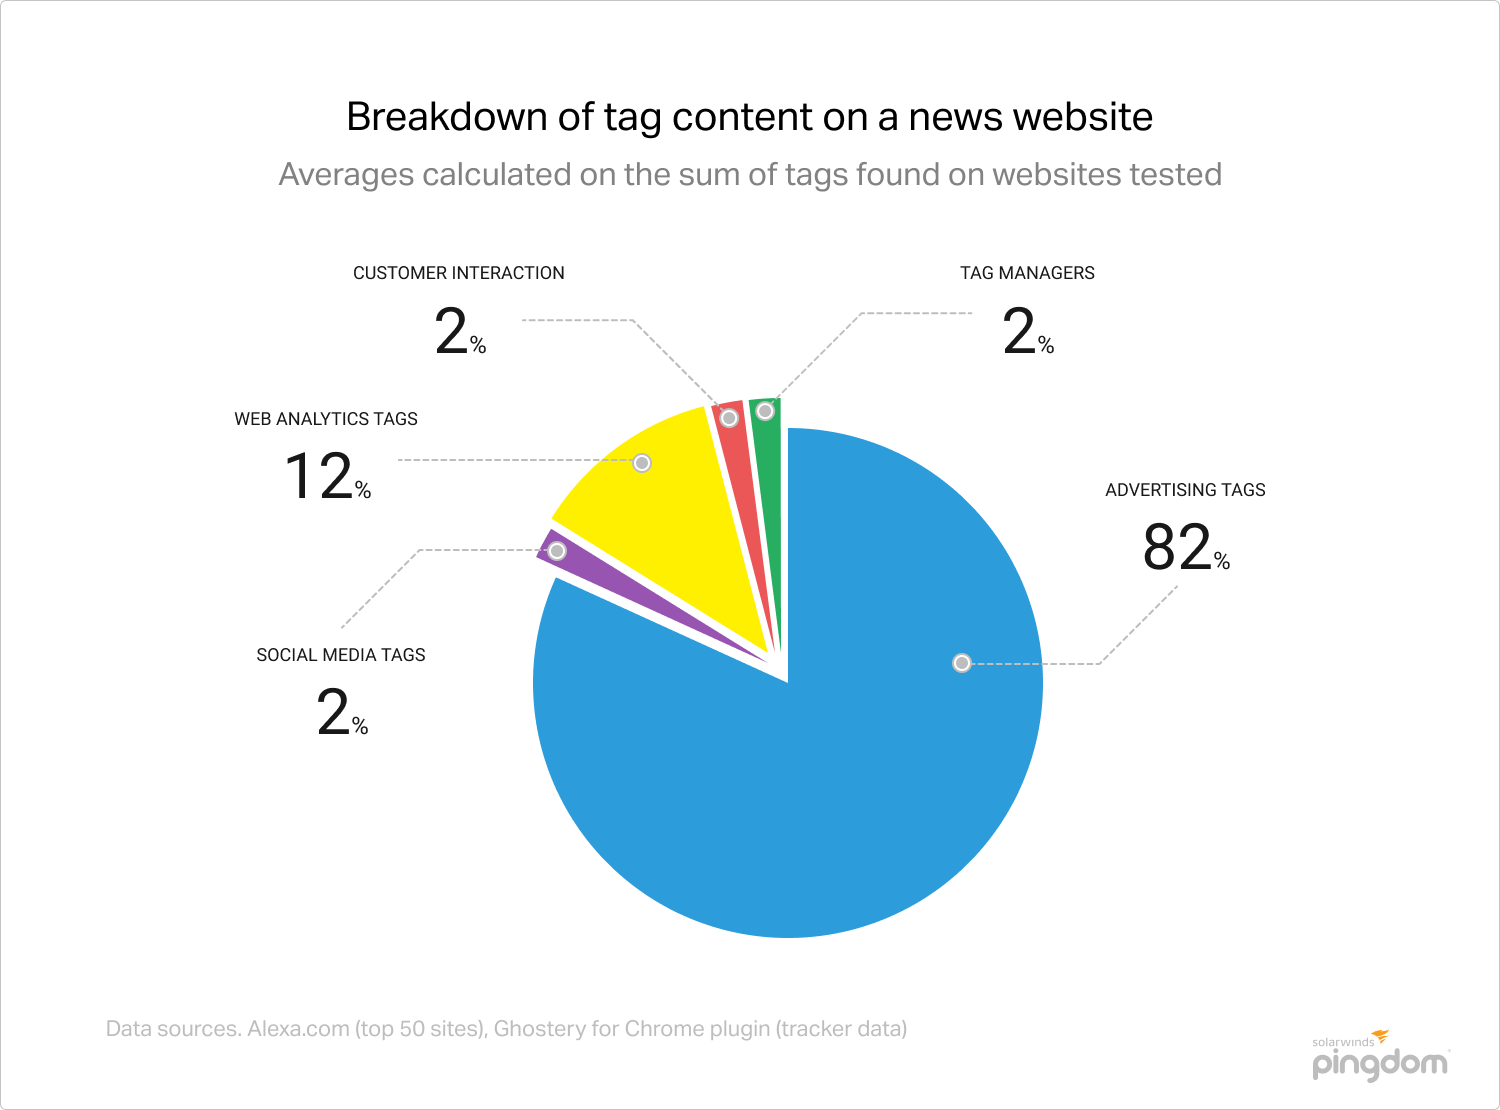
The second most frequent type of tracker (12%) was web analytics trackers, like Google Analytics, Omniture, or Chartbeat, that allows site owners and admins to track site visitor numbers, their journeys, and where they arrived from.
Tag management systems like Google Tag Manager and Quantcount account for 2% of the remaining 6% of trackers. Customer interaction tags like Livefyre and Parse.ly make up another 2%, and social media tags that allow users to share news articles on Facebook, Twitter, etc. make up the remaining 2%.
The average news site loads over 40 trackers
Of the 50 news websites tested, the mean amount of trackers loaded on the homepage was 41, and 42% of sites loaded with 30 to 49 trackers. Interestingly, one of the sites we tested—globaltimes.cn—didn’t load a single known tracker. The only requests that website loaded were to display banners that promoted internal content.
![]()
The dubious honor of having the most trackers load on the homepage is shared by two news sites: nypost.com and chron.com, with 85 trackers upon page load each.
Why so many trackers?
Well, the short answer is that trackers are incredibly helpful when it comes to gathering data on website visitors: from tags that gather data on how users browse websites, where they click and what they interact with, to tags that load rich content like video and tags that store and organize other tags within themselves.
We can accept that tags are useful and even necessary to delivering a great website experience, but each tag deployed will increase that page’s load time. To highlight this point, we plotted the distribution of load times for all the pages we tested. Almost half of the sites (42% to be exact) had a load time of over 9 seconds.
Graphs or it didn’t happen
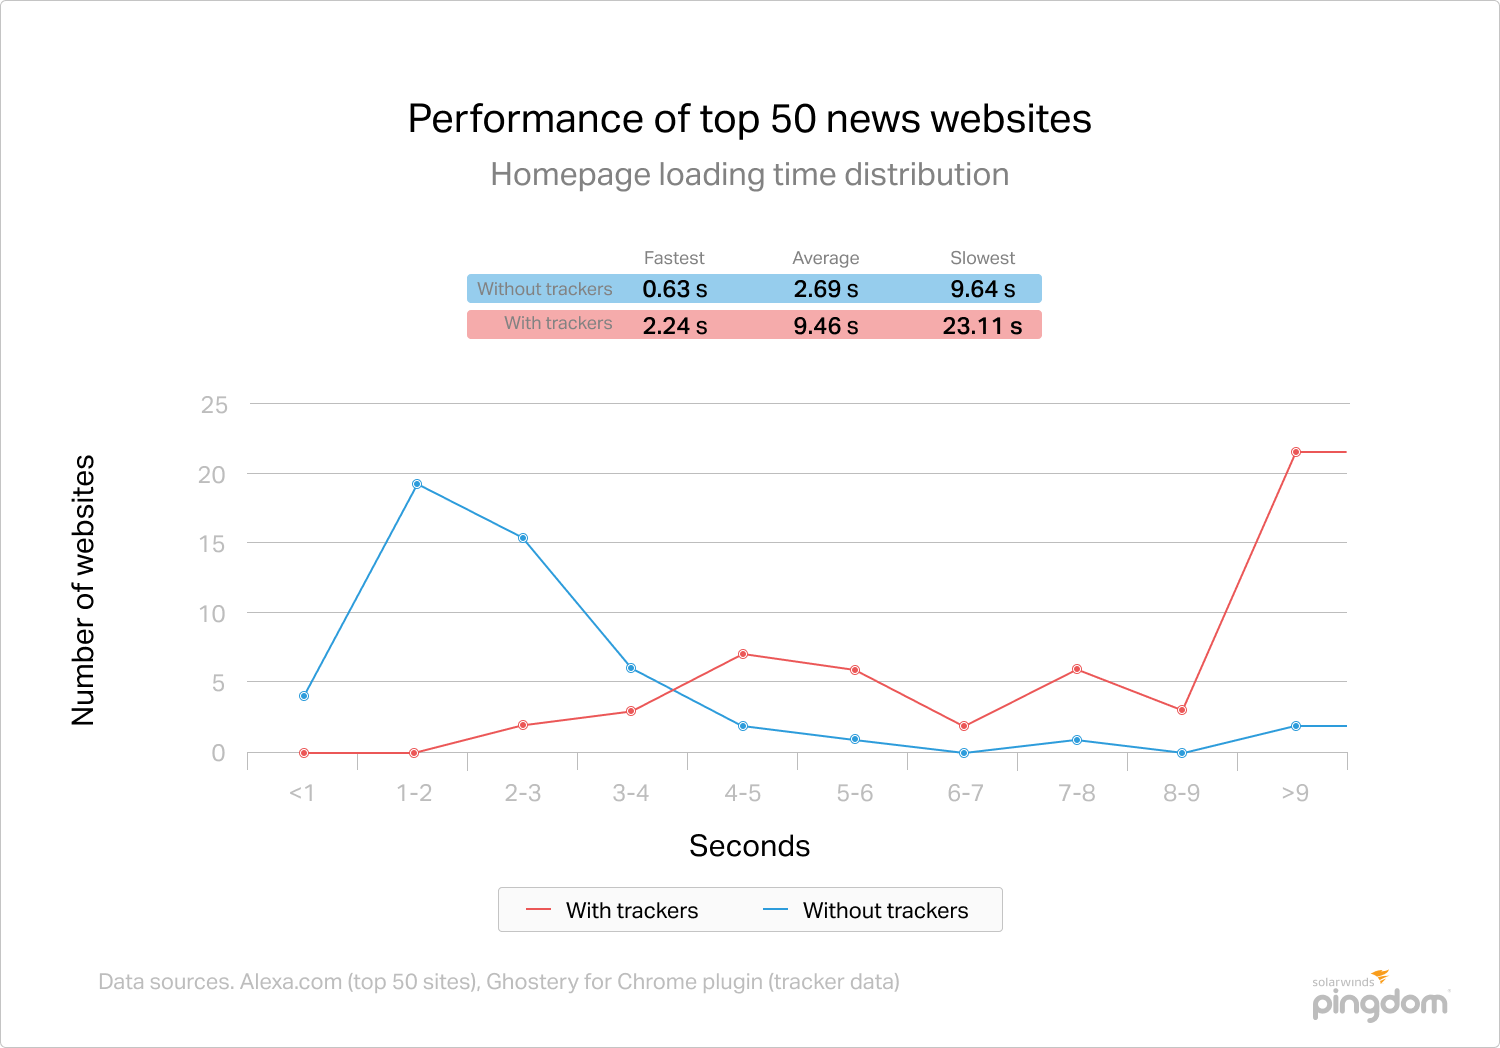
In contrast to this, we then performed the same tests again but with all of the trackers blocked and saw that the load time distribution was significantly different.
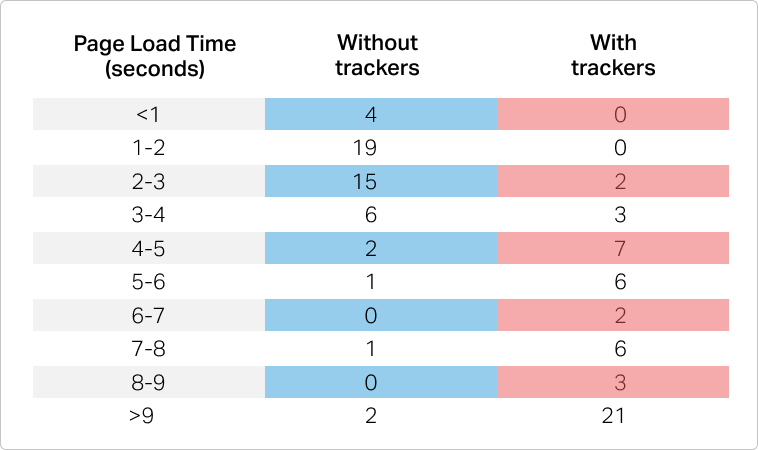
With all trackers disabled, 76% of the top 50 news sites loaded in 3 seconds or less, and the average page load time for all pages tested dropped to 2.69 seconds. From this, we can take that the average number of tags increases the average page load time by 6.77 seconds.
Of course, removing all your site trackers might give you an incredibly fast website, whether it be a news site, blog, or online storefront. In reality, this is rarely, if ever, a viable option. After all, trackers perform valuable tasks and help deliver insights and at the end of the day a better site experience.
The question we should ask ourselves is whether we need so many different ones on our websites. In the test we performed on the top 50 websites alone, we identified 225 different advertising trackers and 58 different analytics trackers.

Keep track of your trackers
Since trackers are here to stay, at least in the near future, our main protection against page fatigue caused by these little snippets of code is to regularly perform some site housekeeping. This means assessing what each of them does on your site and how it benefits your visitors.
In the case of news websites, many rely on keeping a large stable of advertising trackers as that’s how they earn a significant portion of their revenue. Yet even here, you can assess which ad platforms bring in revenue and cull those that don’t perform.
Having analytics on your site is likewise crucial to understanding your customers. But rather than having the same data fed into many different analytics platforms, invest in one which can collate these separate data points into one dashboard.
In short, assess and reassess periodically whether the benefit that each tracker brings to your visitors or your business outweighs the potential sacrifice in website loading performance.
The Pingdom trademarks, service marks, and logos are the exclusive property of SolarWinds Worldwide, LLC or its affiliates. All other trademarks are the property of their respective owners.


