Synthetic Monitoring

Simulate visitor interaction with your site to monitor the end user experience.

View Product Info

FEATURES

Simulate visitor interaction

Identify bottlenecks and speed up your website.

Learn More

Real User Monitoring

Enhance your site performance with data from actual site visitors

View Product Info

FEATURES

Real user insights in real time

Know how your site or web app is performing with real user insights

Learn More

Infrastructure Monitoring Powered by SolarWinds AppOptics

Instant visibility into servers, virtual hosts, and containerized environments

View Infrastructure Monitoring Info
Comprehensive set of turnkey infrastructure integrations

Including dozens of AWS and Azure services, container orchestrations like Docker and Kubernetes, and more 

Learn More

Application Performance Monitoring Powered by SolarWinds AppOptics

Comprehensive, full-stack visibility, and troubleshooting

View Application Performance Monitoring Info
Complete visibility into application issues

Pinpoint the root cause down to a poor-performing line of code

Learn More

Log Management and Analytics Powered by SolarWinds Loggly

Integrated, cost-effective, hosted, and scalable full-stack, multi-source log management

 View Log Management and Analytics Info
Collect, search, and analyze log data

Quickly jump into the relevant logs to accelerate troubleshooting

Learn More

Pingdom’s Web Performance Year in Review 2017

2017 was a big year for us at Pingdom – we celebrated our 10th birthday! We also had plenty more reason to celebrate: we added plenty of nice new features to our tools, like Filmstrip for Page Speed monitoring and Threshold alerting for Uptime monitoring.

We also released major updates to our iOS and Android apps, launched new servers in Latin America and released our next-generation end-user monitoring: Visitor Insights.

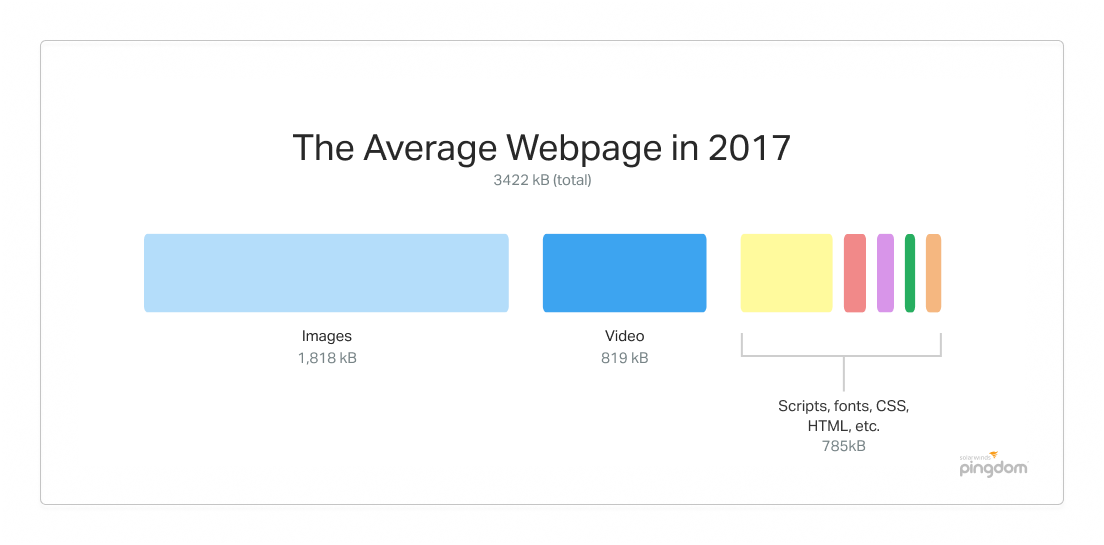
But while we were busy on all of this, we still had time to perform over 262 billion tests last year! In doing so, we collected a lot of interesting data. For instance, here’s how the average webpage looked in 2017:

Join us as we look back on the past year in numbers in our Web Performance Year in Review. We hope you’ll enjoy it!

A big thank you to everyone joined in making the web faster and more reliable!

Exploring the Software Behind Facebook, the World’s Largest Social Media Site

At the scale that Facebook operates, several traditional approaches to serving w [...]

The Developer Obsession With Code Names – 200+ Interesting Examples

Code names can be about secrecy, but when it comes to software development, it†[...]

Web API Monitoring Explained: A Helpful Introductory Guide

An API, application programming interface, is a collection of tools, protocols, [...]

User Experience for Observability

Modern software applications involve multiple layers of code and services, work [...]

Announcing SolarWinds Observability

At SolarWinds, we’re constantly thinking ahead to develop observability solut [...]

Monitor your website’s uptime and performance

With Pingdom's website monitoring you are always the first to know when your site is in trouble, and as a result you are making the Internet faster and more reliable. Nice, huh?

START YOUR FREE 30-DAY TRIAL

MONITOR YOUR WEB APPLICATION PERFORMANCE

Gain availability and performance insights with Pingdom – a comprehensive web application performance and digital experience monitoring tool.

START YOUR FREE 30-DAY TRIAL
Start monitoring for free