


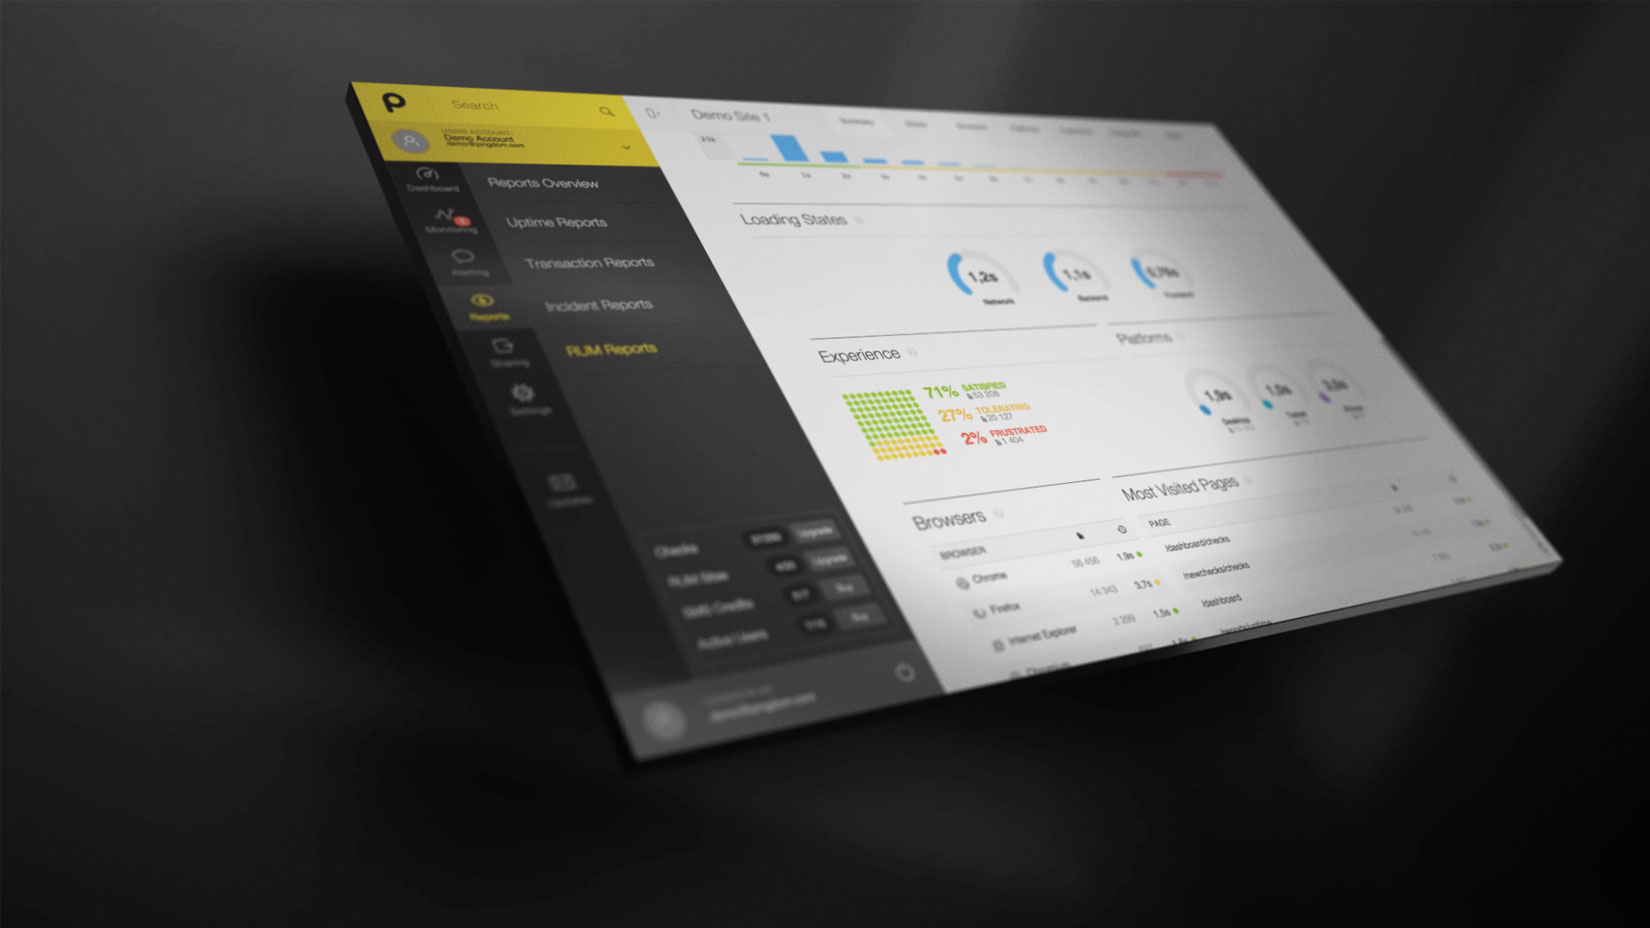
 It may happen that you find yourself in a situation where Pingdom reports that your site or server is unavailable, but in your browser you see it as up and running. There may be many reasons that can explain the discrepancy, and we try our best to give you some idea of what is going on and why our tools consider your check to be down.
I’d like a second opinion please
First of all, Pingdom is an external monitoring service. What this means is that our probe servers will connect to your site or server from outside the local network where the server hosted. Therefore, your site or server may still be locally accessible even though Pingdom can’t access it.
When one of our probe servers cannot connect to a site or server, Pingdom’s system will first mark the check as unconfirmed and then ask another probe server to try to make the same connection, we call this a Second Opinion, we try to make the second opinion as geographically different as possible to make it easier to determine where the issue is.
Your check (site or server) will only be marked as confirmed down if the second test also fails. It will continue to be marked as Down as long as consecutive probe requests register errors.
The reason we try to use probe servers as geographically spread our for the second opinion is that if there still is an issue it is more likely closer to your server and less likely a routing error on the way to your server.
What caused the confirmed down?
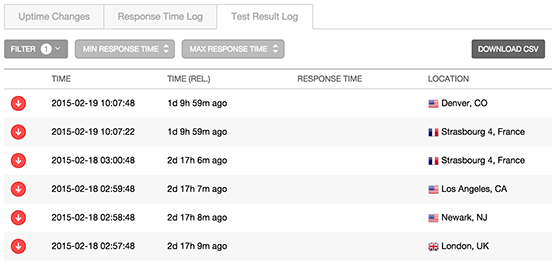
To find out what caused the outage, what cause our system to mark your check as down, take a look at the Root Cause Analysis and Test Result Log, which will show you further details about the outage.
The Test Result Log, as the name implies, is the data our probes report for each request to your URL they make. It contains the response time as well as the error the probe detected.
The Root Cause Analysis is an additional tool that is run from the first two probe servers that detected the discrepancy. The Root Cause Analysis contains a bit more data than what the regular checks are configured to gather, such as a trace-route and the content of the returned data, note that the analysis is run slightly after the error was detected and if it is a brief issue the Root Cause Analysis might not be able to see what caused it.
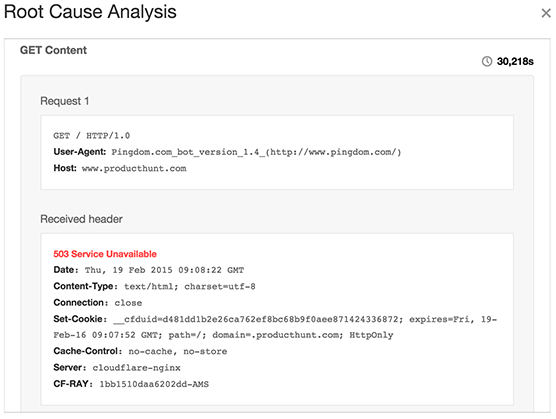
The result of the Root Cause Analysis
If the outage was short (less than one or a few minutes) or was intermittent, it was most likely caused by a temporary issue somewhere between the probe server locations and your site or server. This kind of issues are very hard to determine the exact cause of the problem.
If the error reported in the Test Result Log is something along the lines of Connection Reset or Socket Timeout the issue may be that the requests from our probes is getting refused by a firewall, there are routing issues. A time out means that the response from the requested server took longer than 30 seconds to reach our probes.
If you filter traffic with the help of a blacklist, or use a white list approach, then make sure that you add our probe servers IP addresses to your white list. Also, keep the white list up to date, as new probe servers are added to the Pingdom service, or details of existing probe servers change. We always announce new probe servers, and changes to existing ones, days before deployments are made. You can read about how to find a list of our probe servers and their details here.
If the errors for the outage in the Test Result Log is Unknown target or DNS error it may be that the outage is related to propagation of new DNS records or issues with cached NX records. Each of our probe servers run their own individual Bind9 caching DNS server as their DNS resolver, thus DNS records will be cached. If invalid records were returned, NX domain records will be cached for that domain. Unfortunately, in such a case you have to wait until the invalid records have expired, as our probes obey the TTL records.
To mitigate DNS issues when you change your servers around or make other updates to your DNS settings there are some general steps that are good to follow:
- Set up the new server, if you are moving to a new server.
- Keep your old server up and running for the time being.
- Change the DNS records to reflect your new servers IP address.
- Wait for the DNS change to propagate through the Internet.
- Once you are sure people and our probes are resolving the new IP address, you’re done. You can take the old server offline.
Credit: 404 error icon by Julien Deveaux, The Noun Project


