


With Pingdom’s Real User Monitoring (RUM) service, you can know exactly how your visitors experience your website. It gives you insight into your website’s performance and helps you answer questions like, how does your website really perform from a specific country, device, or web browser.
Today we’re releasing a simple tool with which you can display the real user performance of any website, not just the ones you monitor. Think of it as a sample of what the full Real User Monitoring service can do.
The Real User Monitoring bookmarklet is free and easy to install. Here’s what it does and how to get started.
What the bookmarklet does
To put it briefly, the bookmarklet enables you to view the performance of any website you browse to. It is based on the same Real User Monitoring technology that our customers are already using to monitor the performance of thousands of websites.
Before we get to how to install the bookmarklet, let’s spend some time on RUM. Real User Monitoring gives you a detailed view of the performance of your site and how real users experience it, at the moment they browse into it. When you have RUM enabled for your site, we collect data from all visitors to the site in real-time. This can involve what kind of connections, browsers, and devices your visitors are using, their geographic location, and more. And you see aggregated data over different time periods based on each and every user that visits your site, not a limited sample of the data.
 Keep in mind that although the bookmarklet displays much the same information as you would see if you have RUM enabled on your site, there are some important differences:
- The bookmarklet only provides a snapshot of a site’s performance at the moment you visit it.
- With RUM enabled you can see real user data based on all visits over different periods of time, including how it changes in real-time.
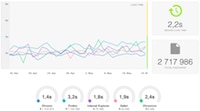
- In the RUM section of your account in my.pingdom.com you can see the visitor data aggregated and summarized in easy-to-use charts and graphs.
- This means, for example, that you can see how visitors from a particular country or those who use a particular browser experience your site.
How to add the bookmarklet
To start using the bookmarklet is really easy. Just drag the button below (it says “Real User Monitoring”) to the bookmarks toolbar in your browser and you’re all set to go.
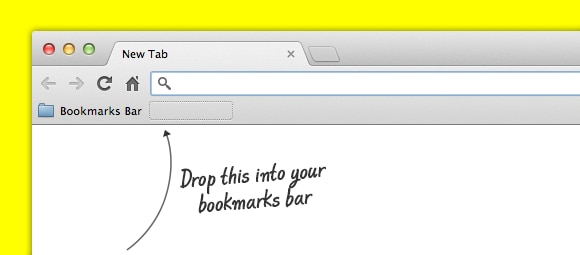
Once the link is added to your bookmarks toolbar, go to the site you want to see the performance of and click the link in the toolbar.
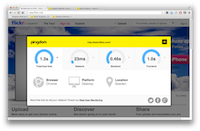
You will then be presented with a display showing you the performance of that site. For example:
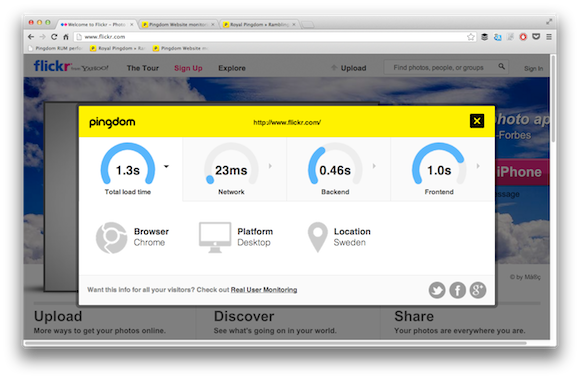
From there you can share the performance of the site you visited using Facebook, Google+, and Twitter.
Try Real User Monitoring bookmarklet today
We hope you will try the RUM bookmarklet and use it to have a look at the performance of different websites you visit. If you would want to keep an eye on your site’s performance, sign up for an account to start monitoring it today.
We have collected a wide range of resources for you if you want to learn more about Real User Monitoring and how it can help you improve the performance of your site.
Note about compatibility: The Real User Monitoring bookmarklet works in Chrome, Firefox, and Internet Explorer 9 and 10. It does not currently work in Opera or Safari.


