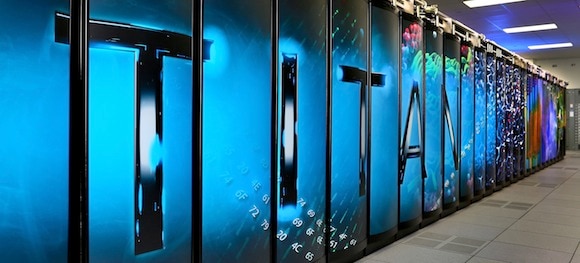
There’s a new supercomputer at the top of the Top 500 list. The new champion is the Titan, a Cray XK7 system installed at the Oak Ridge National Laboratory in the US. It achieves 17.59 Petaflop/s with 560,640 cores, beating the previous number one, the Sequoia at Lawrence Livermore National Laboratory, which reaches 16.32 Petaflop/s.
Given that there is a new number one, we want to update our article from earlier this year and include the Titan. Let’s see how the new number one supercomputer in the world compares to its predecessors.
Number of cores
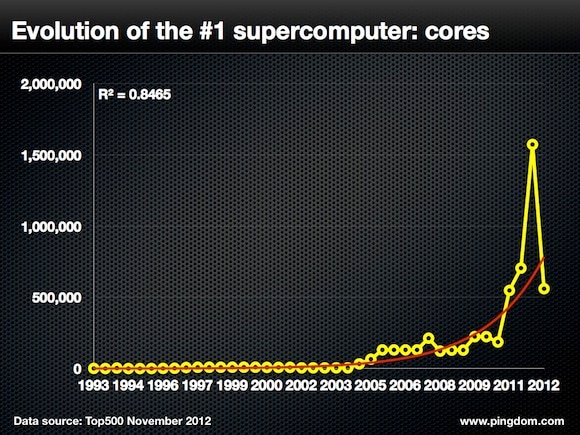
One of the most noticeable things about the new supercomputer champ is that it breaks the trend of increasing number of cores. The Sequoia has 1,572,864 cores, almost three times as many as the Titan’s 560,640 cores. In the previous update of the Top500 list, the Sequoia more than doubled the cores compared to the previous number one, the K Computer’s 705,024 cores.
It should be pointed out that not all cores are created equal. Apparently, 90% of Titan’s performance comes from 261,632 NVIDIA GPUs, the company’s new K20x.
Performance
You would perhaps think that fewer cores should mean less performance, but obviously not so when it comes to the Titan. As mentioned above, the Titan cranks out 17.59 Petaflop/s with 560,640 cores. However, that’s not as much a leap from the previous number one as the dethroned Sequoia took earlier in the year (an increase from 10.51 to 16.3 Petaflop/s).
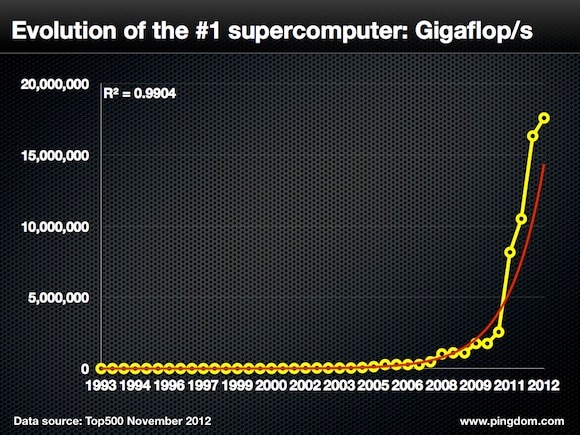
Just to put things in perspective, it’s worth mentioning that the fastest supercomputer in 1993 clocked in at 59.7 Gigaflop/s using 1,024 cores.
Power consumption
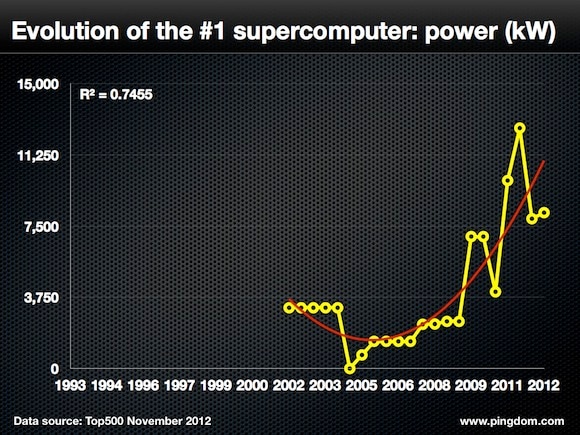
When the Top500 started reporting power consumption in 2002, the world’s fastest supercomputer required 3,200 kW. Today, the Titan wants 8,209 kW. This is a slight increase from the Sequoia, which consumed 7,890 kW.
Performance per core
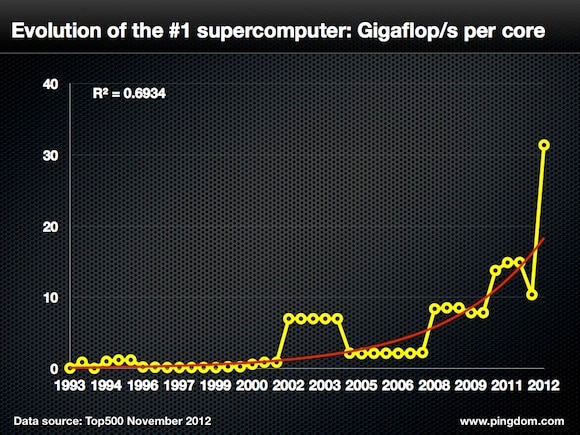
This is where it gets really interesting when looking at the latest Top500 list because the Titan has tripled the performance per core ratio compared to the Sequoia. Titan achieves 31.37 Gigaflop/s per core and the Sequoia reaches 10.38 Gigaflop/s per core. This is clearly a substantial leap for supercomputers in terms of how much performance can be extracted from each core.
Power efficiency
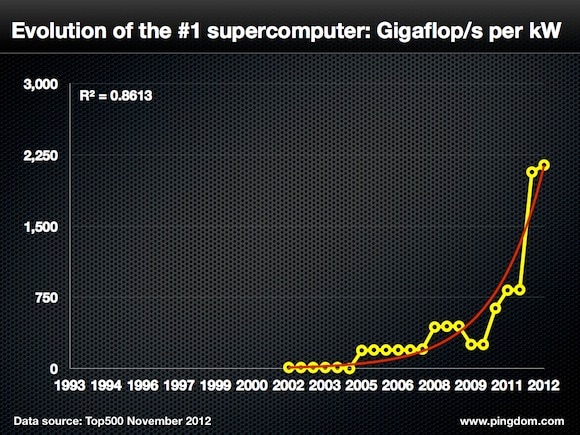
Power efficiency stands as one of the main factors to deal with for anyone involved with supercomputers. Since power is costly and sometimes also in short supply, anyone operating a supercomputer would want to minimize the power consumption, or, at the very least, optimize it so that they get as much performance per unit of energy as possible. In this regard, the Titan only represents a small step forward. The Titan is able to produce 2,143 Gigaflop/s per kilowatt, compared to the Sequoia’s 2,069.
A supercomputer generational shift
With this update of the Top500 list, it would seem the world of supercomputers is alive and well, but going through a bit of a generational shift. Fewer cores produce more processing power while using less energy. One main contributor to this is arguably the increasing use of GPUs.
Whether it will be GPUs or something else that will keep pushing supercomputers towards the exascale promised land we don’t know. But if it’s true that the human brain has a processing capacity of around 38 Petaflop/s, with the latest top supercomputer we’re half way there.
As always, once a new Top500 list has been digested, we’re already looking forward to the next one. What do you think will be the big news in another six months?
Top image appears courtesy of Oak Ridge National Laboratory.


