
Sequoia is the name of the the fastest supercomputer in the world, as ranked by Top500. IBM built the BlueGene system and it’s installed at the US Department of Energy’s Lawrence Livermore National Laboratory.
Sequoia is capable of over 16 PFLOPS (quadrillion operations per second) compared to the 10.5 PFLOPS of the previous number one, which was the K Computer at the RIKEN Advanced Institute for Computational Science in Kobe, Japan.
With a new number one, we wanted to see how things have developed over the last couple of decades. We grabbed the specifications for the number one supercomputer from the Top500 website, going back to June 1993, and here’s what we found.
Number of cores
The number of cores in supercomputers has clearly exploded in the last couple of years. In the most recent Top500 list, the number of cores in the reigning supercomputer more than doubled from 705,024 in the K Computer to 1,572,864 in the Sequoia. 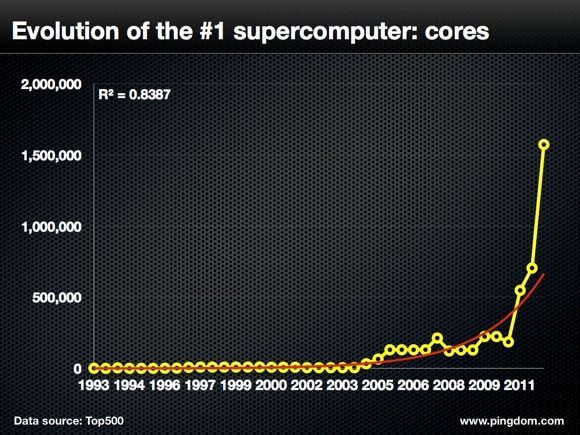
Performance
More cores should mean more performance, even though the number of cores is, of course, just one measure out of many that affect a supercomputer’s performance. In the most recent shift, the peak performance of the number one supercomputer in the world increased from 10,510,000 to 16,324,751 GFLOPS. 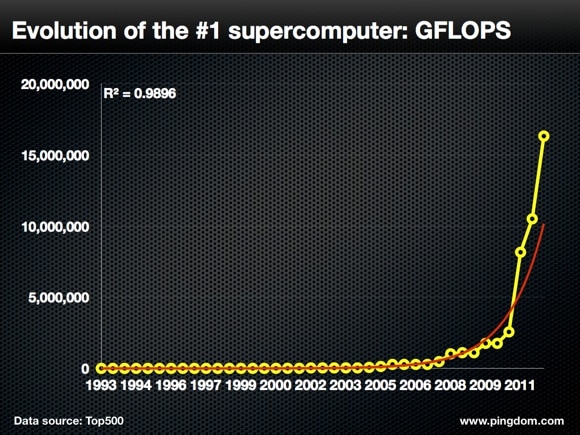
In comparison, the fastest supercomputer in 1993 clocked in at 59.7 GFLOPS.
Power consumption
As the number of cores and processing power has gone up so has the need for power. The Top500 started reporting power consumption in 2002, and since then there’s been an increase from 3,200 kW to the most recent 7,890 kW. It should be pointed out that the IBM Sequoia represents a significant leap forward in energy efficiency, but more on that further down. 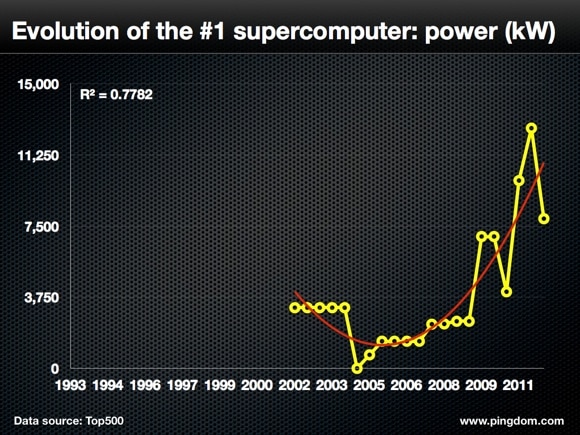
Performance per core
How much computing power each core in a supercomputer produces has increased over time, although perhaps not as dramatically as some of the other measures we present here. In 1993, each core in the number one supercomputer produced 0.06 GFLOPS. This has increased to 10.38 GFLOPS per core in the Sequoia supercomputer. 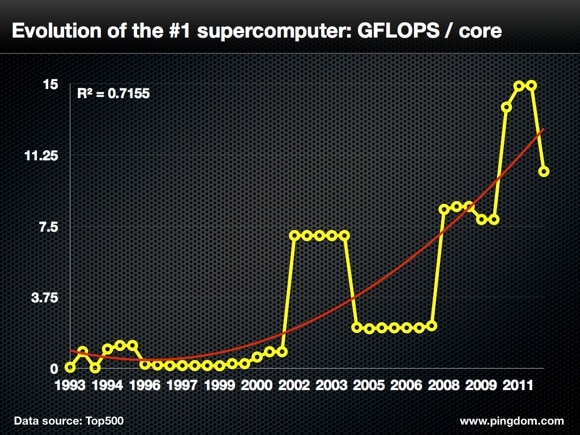
Power efficiency
Arguably, one of the biggest challenges for the supercomputing industry right now is power efficiency; to produce more performance but use less energy. IBM’s Sequoia is able to produce 2,069 GFLOPS per kilowatt, compared to the K Computer’s 830. That is a significant leap forward in power efficiency.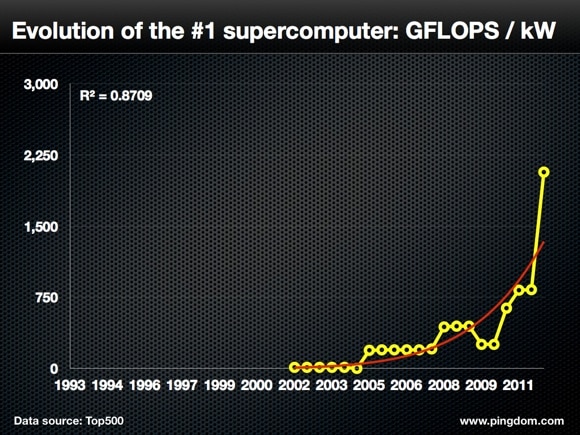
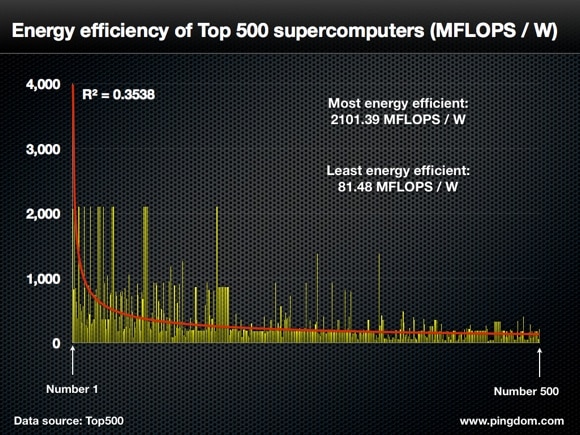
But the Sequoia is not the most energy-efficient supercomputer on the list. That honor belongs to another IBM system, which, in position 252 on the top 500, produces 2,101.39 MFLOPS per watt.
Charting all 500 supercomputers, we see that there is quite a spread in power efficiency. We already mentioned the most energy-efficient supercomputer. On the other end of the spectrum, a Cray computer in 82nd place “only” manages to produce 81.48 MFLOPS per watt.
Exascale is within sight
For most of us, the closest we’ll ever get to a supercomputer is seeing one in a movie. These beasts are vitally important for research and development for companies and governments around the world. Chances are that many of the products you use today have, at some point or another, been designed and tested with the help of a supercomputer.
With the top supercomputers now reaching into petaFLOPS, exascale is the next frontier, with a thousandfold increase over current levels of performance. But as tempting as that performance increase is, we suspect that engineers working on supercomputers will find it more challenging to reach new, and much needed, levels of energy efficiency.
Top image appears courtesy of IBM.


