Synthetic Monitoring

Simulate visitor interaction with your site to monitor the end user experience.

View Product Info

FEATURES

Simulate visitor interaction

Identify bottlenecks and speed up your website.

Learn More

Real User Monitoring

Enhance your site performance with data from actual site visitors

View Product Info

FEATURES

Real user insights in real time

Know how your site or web app is performing with real user insights

Learn More

Infrastructure Monitoring Powered by SolarWinds AppOptics

Instant visibility into servers, virtual hosts, and containerized environments

View Infrastructure Monitoring Info
Comprehensive set of turnkey infrastructure integrations

Including dozens of AWS and Azure services, container orchestrations like Docker and Kubernetes, and more 

Learn More

Application Performance Monitoring Powered by SolarWinds AppOptics

Comprehensive, full-stack visibility, and troubleshooting

View Application Performance Monitoring Info
Complete visibility into application issues

Pinpoint the root cause down to a poor-performing line of code

Learn More

Log Management and Analytics Powered by SolarWinds Loggly

Integrated, cost-effective, hosted, and scalable full-stack, multi-source log management

 View Log Management and Analytics Info
Collect, search, and analyze log data

Quickly jump into the relevant logs to accelerate troubleshooting

Learn More

New Pingdom feature: Custom monitoring type

What if you could have a type of monitoring that would store a value of your choosing, and a status of your choosing, based on a script on your servers? A kind of “universal” check type that you can customize as you wish on your end. Well, now you can.

Pingdom custom monitoring

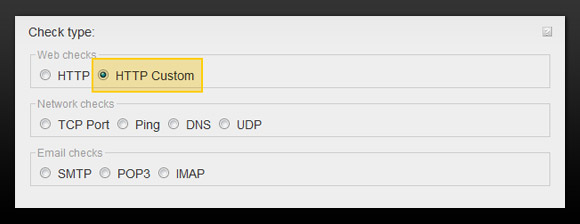
We have added a new, customizable check type to the Pingdom uptime monitoring service, called simply “HTTP custom”. It expects a formatted XML response with a status (OK/not OK) and a value (a number). This value replaces the “response time” value in the Pingdom graphs, and the status (OK or not) replaces the UP or DOWN status.

Pingdom custom monitoring setup

Since you are returning a value and a status every time your XML page is accessed (for example once a minute), you will be able to see this data in the graphs in the Pingdom control panel, and of course be sent alerts just as with any other Pingdom check.

This may all sound a bit abstract, so let’s look at some examples of how this new check type can be used.

  • Monitor the amount of free RAM or HD space on your server.
  • Monitor the CPU load on your server.
  • Monitor the number of active connections to your web server.
  • And any other monitoring type you can imagine…

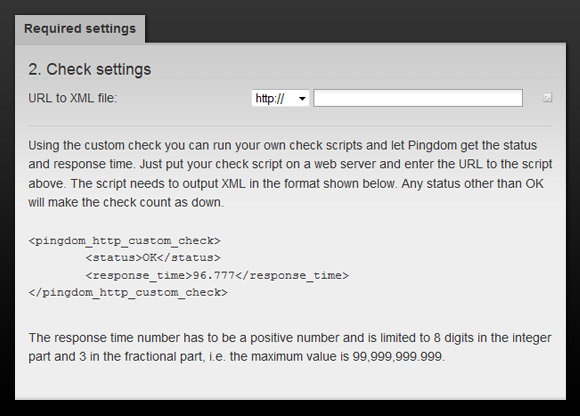
All you need is a script that performs some form of task on your end and sends back the status and value of the operation in the specified XML format. Your script decides what is considered UP (i.e. OK), so you have full control over thresholds and what is tested on your end.

Of course, nothing stops you from performing more advanced tasks than the ones we mentioned above. The imagination is the limit here. What we do on our end is simple, we just get this XML file from you. How you generate it is completely up to you.

We hope you will find good use for this new functionality. As always, we welcome any feedback you may have!

Note: This check will time out if it cannot read the XML file within 30 seconds, which counts as a “down” on Pingdom’s end. So if you decide to create a really elaborate, time-consuming script on your end, you may be best off letting it run separately and just have it continuously update a status page (the XML file) that is accessed by Pingdom.

Also, if the server your script runs on (or rather the XML file) is unreachable for some reason, this will also count as a “down” on Pingdom’s end, so make sure your script runs on a reliable server with a good Internet connection.

Webpages Are Getting Larger Every Year, and Here’s Why it Matters

Last updated: February 29, 2024 Average size of a webpage matters because it [...]

A Beginner’s Guide to Using CDNs

Last updated: February 28, 2024 Websites have become larger and more complex [...]

The Five Most Common HTTP Errors According to Google

Last updated: February 28, 2024 Sometimes when you try to visit a web page, [...]

Page Load Time vs. Response Time – What Is the Difference?

Last updated: February 28, 2024 Page load time and response time are key met [...]

Can gzip Compression Really Improve Web Performance?

Last updated: February 26, 2024 The size of the web is slowly growing. Over [...]

Monitor your website’s uptime and performance

With Pingdom's website monitoring you are always the first to know when your site is in trouble, and as a result you are making the Internet faster and more reliable. Nice, huh?

START YOUR FREE 30-DAY TRIAL

MONITOR YOUR WEB APPLICATION PERFORMANCE

Gain availability and performance insights with Pingdom – a comprehensive web application performance and digital experience monitoring tool.

START YOUR FREE 30-DAY TRIAL
Start monitoring for free