Synthetic Monitoring

Simulate visitor interaction with your site to monitor the end user experience.

View Product Info

FEATURES

Simulate visitor interaction

Identify bottlenecks and speed up your website.

Learn More

Real User Monitoring

Enhance your site performance with data from actual site visitors

View Product Info

FEATURES

Real user insights in real time

Know how your site or web app is performing with real user insights

Learn More

Infrastructure Monitoring Powered by SolarWinds AppOptics

Instant visibility into servers, virtual hosts, and containerized environments

View Infrastructure Monitoring Info
Comprehensive set of turnkey infrastructure integrations

Including dozens of AWS and Azure services, container orchestrations like Docker and Kubernetes, and more 

Learn More

Application Performance Monitoring Powered by SolarWinds AppOptics

Comprehensive, full-stack visibility, and troubleshooting

View Application Performance Monitoring Info
Complete visibility into application issues

Pinpoint the root cause down to a poor-performing line of code

Learn More

Log Management and Analytics Powered by SolarWinds Loggly

Integrated, cost-effective, hosted, and scalable full-stack, multi-source log management

 View Log Management and Analytics Info
Collect, search, and analyze log data

Quickly jump into the relevant logs to accelerate troubleshooting

Learn More

Netcraft web server stats 2003-2012 in one chart

web server surveyToday Netcraft released its web server survey for July 2012, and we know many of you hurried to read how things have developed since last month (as did we).

What we’ve done is collect Netcraft’s data going back to 2003 and put that in one spreadsheet, which makes it easier to see how things have developed over the last 9 years or so. You can see the rise of NGINX, the fall of a few servers, as well as the continued domination of Apache.

Remember http://png.dm/netcraftchart. That’s the URL for a Google Doc you can come back to each month. As soon as there are new numbers out from Netcraft, we’ll add them to the document. You can see the numbers as well as the chart, which currently looks like this:
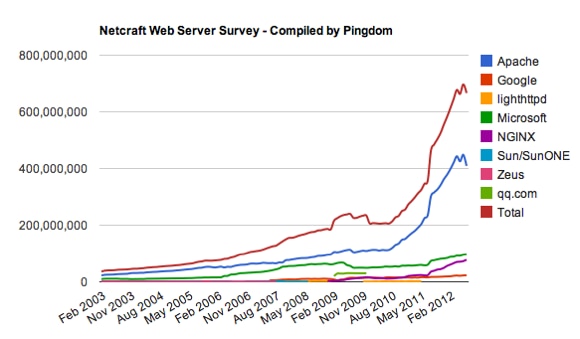
netcraft web server survey

Note that the information in the spreadsheet is what Netcraft calls “Total Sites Across All Domains”.

We hope you will find this useful.

Image (top) via Shutterstock.

SolarWinds Observability now offers synthetic transaction monitoring

Powerful transaction monitoring now complements the availability and real user [...]

Exit Rate vs Bounce Rate – Which One You Should Improve and Why

Tracking your website’s exit and bounce rates will give you insight into how [...]

Introduction to Observability

These days, systems and applications evolve at a rapid pace. This makes analyzi [...]

Webpages Are Getting Larger Every Year, and Here’s Why it Matters

Last updated: February 29, 2024 Average size of a webpage matters because it [...]

A Beginner’s Guide to Using CDNs

Last updated: February 28, 2024 Websites have become larger and more complex [...]

Monitor your website’s uptime and performance

With Pingdom's website monitoring you are always the first to know when your site is in trouble, and as a result you are making the Internet faster and more reliable. Nice, huh?

START YOUR FREE 30-DAY TRIAL

MONITOR YOUR WEB APPLICATION PERFORMANCE

Gain availability and performance insights with Pingdom – a comprehensive web application performance and digital experience monitoring tool.

START YOUR FREE 30-DAY TRIAL
Start monitoring for free