Synthetic Monitoring

Simulate visitor interaction with your site to monitor the end user experience.

View Product Info

FEATURES

Simulate visitor interaction

Identify bottlenecks and speed up your website.

Learn More

Real User Monitoring

Enhance your site performance with data from actual site visitors

View Product Info

FEATURES

Real user insights in real time

Know how your site or web app is performing with real user insights

Learn More

Infrastructure Monitoring Powered by SolarWinds AppOptics

Instant visibility into servers, virtual hosts, and containerized environments

View Infrastructure Monitoring Info
Comprehensive set of turnkey infrastructure integrations

Including dozens of AWS and Azure services, container orchestrations like Docker and Kubernetes, and more 

Learn More

Application Performance Monitoring Powered by SolarWinds AppOptics

Comprehensive, full-stack visibility, and troubleshooting

View Application Performance Monitoring Info
Complete visibility into application issues

Pinpoint the root cause down to a poor-performing line of code

Learn More

Log Management and Analytics Powered by SolarWinds Loggly

Integrated, cost-effective, hosted, and scalable full-stack, multi-source log management

 View Log Management and Analytics Info
Collect, search, and analyze log data

Quickly jump into the relevant logs to accelerate troubleshooting

Learn More

How to Implement Visitor Insights Snippet in 3 Steps

We’d argue that anybody with a website needs site monitoring, and our latest tool is no exception. As with all of our web performance tools, we strive to make setup as quick and hassle-free as possible.

Visitor Insights is no exception: whilst it collects an incredible amount of visitor data from your site, setting it up can be done in a few minutes. Don’t believe us? See for yourself how easily it’s done in the video below:

Missed that?

No worries, just follow our step-by-step instructions below for a problem-free Visitor Insights setup:

1. Go to Visitor Insights in My Pingdom

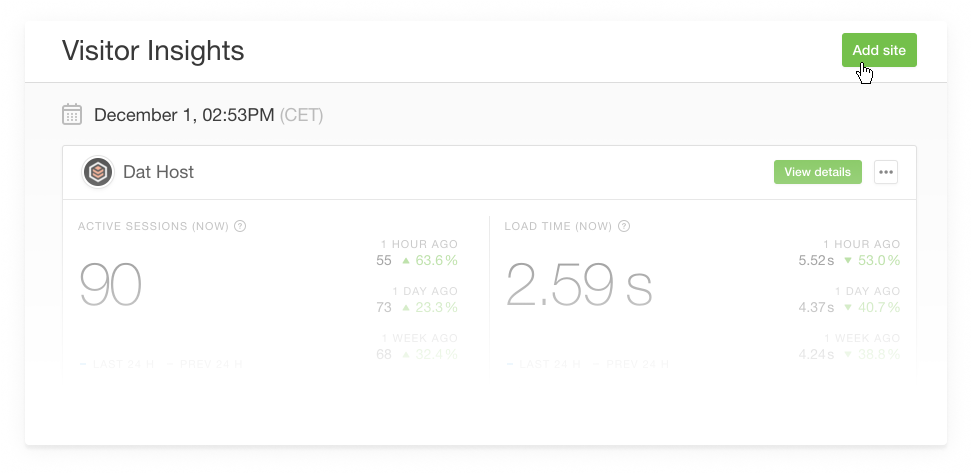
Click on ‘Add Site‘ in the top right-hand corner.

2. Enter the site you want to monitor and get your snippet

Don’t forget to name your site in My Pingdom, especially if you plan to have several checks later.

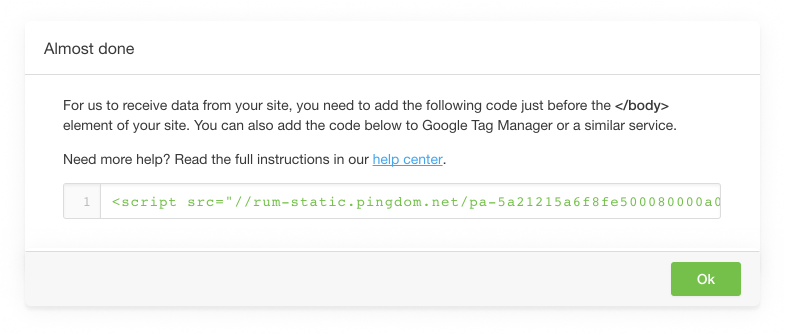
3. Implement your code snippet

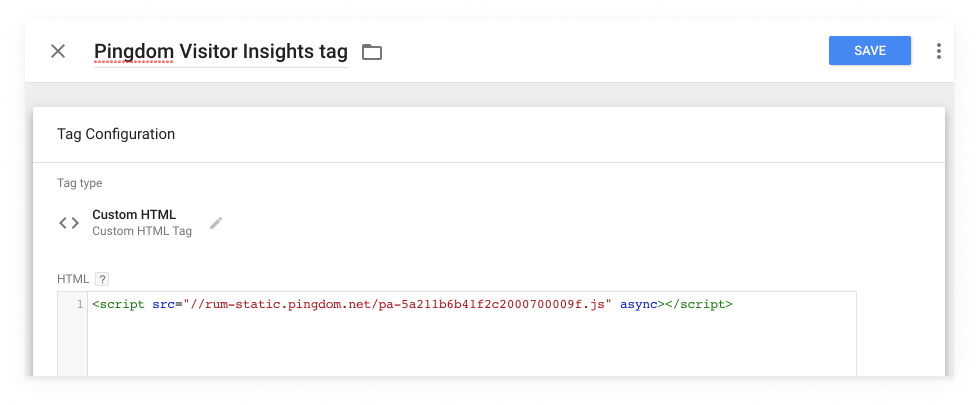
You can implement it directly into your site or through your tag management system, like Google’s Tag Manager. If you’re implementing it directly, don’t forget to do so just before the </body> tag of your site.

Within seconds you’ll see your site visitor data appear in your Visitor Insights dashboard in My Pingdom.

It’s that simple!

Introduction to Observability

These days, systems and applications evolve at a rapid pace. This makes analyzi [...]

Webpages Are Getting Larger Every Year, and Here’s Why it Matters

Last updated: February 29, 2024 Average size of a webpage matters because it [...]

A Beginner’s Guide to Using CDNs

Last updated: February 28, 2024 Websites have become larger and more complex [...]

The Five Most Common HTTP Errors According to Google

Last updated: February 28, 2024 Sometimes when you try to visit a web page, [...]

Page Load Time vs. Response Time – What Is the Difference?

Last updated: February 28, 2024 Page load time and response time are key met [...]

Monitor your website’s uptime and performance

With Pingdom's website monitoring you are always the first to know when your site is in trouble, and as a result you are making the Internet faster and more reliable. Nice, huh?

START YOUR FREE 30-DAY TRIAL

MONITOR YOUR WEB APPLICATION PERFORMANCE

Gain availability and performance insights with Pingdom – a comprehensive web application performance and digital experience monitoring tool.

START YOUR FREE 30-DAY TRIAL
Start monitoring for free