


Do you find yourself asking, “What should our first service-level objective (SLO) be?” The simplest way to get started if you have a website is to measure uptime SLOs. The SLO will measure your uptime and how your site compares to your reliability goals.
By following the steps outlined here, you can get up and running with your first SLO in minutes.
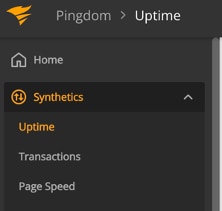
To get started, you’ll need to set up an account on SolarWinds® Pingdom®. If you don’t already have one, click here to sign up for a 30-day free trial. Once you’re done, log in to Pingdom, navigate to Synthetics, and choose “Uptime.”
Click “Add new” in the upper-right corner to create your Uptime metric.
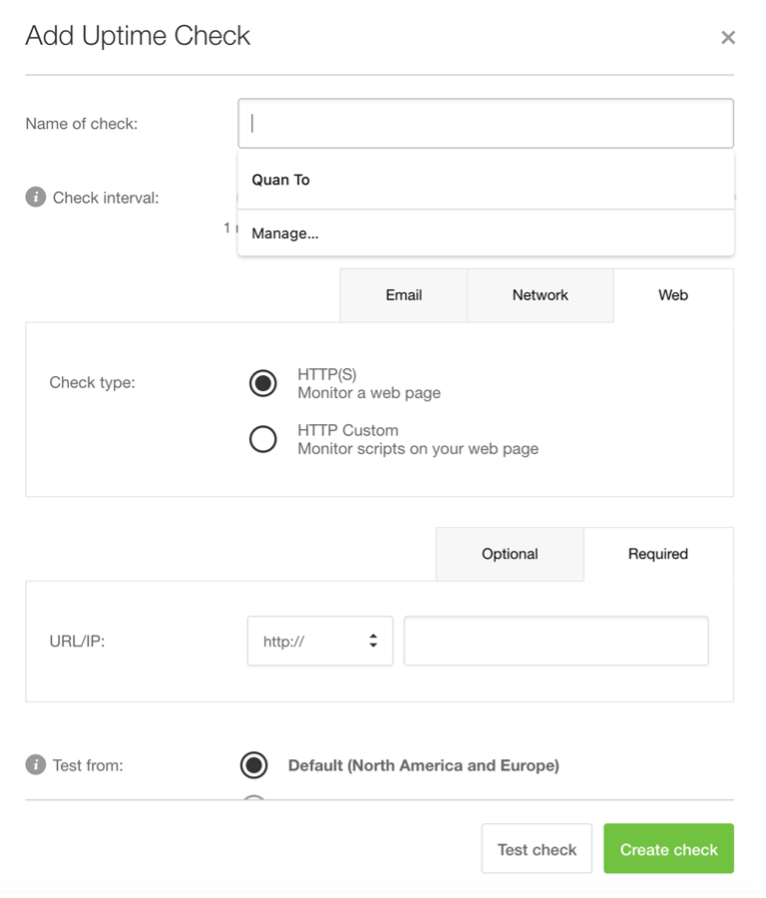
You only need to add the name of the check and the URL. All the other fields are optional, and you can update the configuration at a later time. Next, click “Create check.”
That’s it! You just created your first metric in Pingdom. Now, you can navigate to Nobl9 and add an SLO.
Note: If you haven’t used Nobl9 before, you can sign up for a 30-day free trial.
Before you jump into creating an SLO, you’ll need to create a service and add Pingdom as a data source.
Add a Service
In Nobl9, SLOs are grouped under services, and services are grouped under projects. Projects allow you to control who has access to your SLOs and can be used to group teams, group feature areas, or otherwise organize your company.
After logging in to Nobl9, select Catalog from the navigation menu and click on the Services tab.
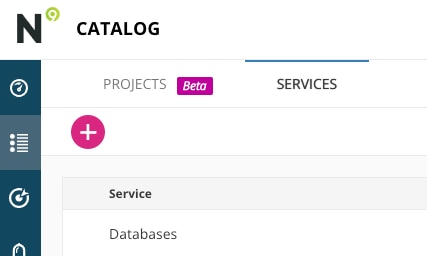
Click the “+” button to add a new service.
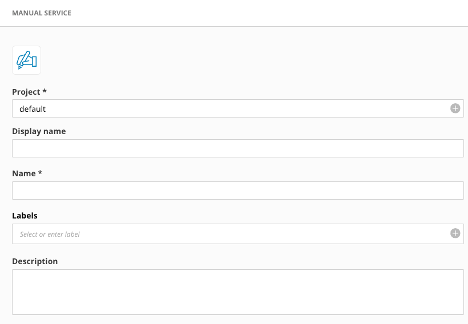
Type the name of the project you want to add your service to in the first field (if you leave this blank, the service will automatically be added to a project called “default”). Then, click the blue “+” to add the service to the project.
Next, add a friendly display name for the service. A Kubernetes-style name will automatically be generated in the Name field. You can then optionally add labels and a description for the service.
When you’re done, click “Add Service.”
Add Pingdom as a Data Source
Before you can add your first SLO, you need to tell Nobl9 about Pingdom. You can do this by adding Pingdom as a data source. The only prerequisite is you need to get a Pingdom API token.
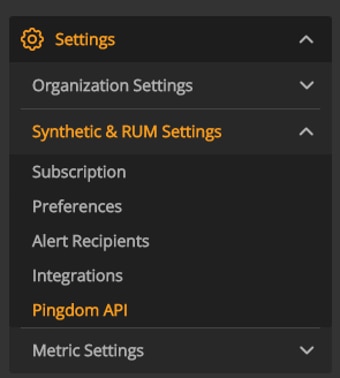
In Pingdom, navigate to Settings, select “Synthetic & RUM Settings,” and select “Pingdom API.”
From the Pingdom API page, you can click “Add API token” to generate a new token to use with Nobl9. The token only needs read access to the data. Store your API token safely; you’ll use it in a few minutes.
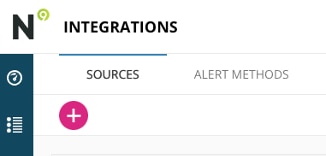
Back in Nobl9, navigate to Integrations and click the “+” on the Sources tab.
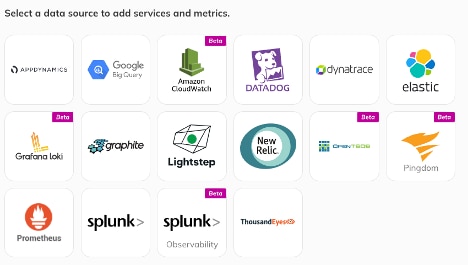
You’ll see the list of data sources supported by Nobl9. Select Pingdom.
Nobl9 supports direct and agent integrations with Pingdom. Direct integrations require your API token, which Nobl9 will securely store. Agent integrations require you to deploy an agent to gather the Pingdom metrics and send them back to Nobl9. You pass the API token to the agent, and Nobl9 doesn’t store your credentials.
For this example, select “Direct.”
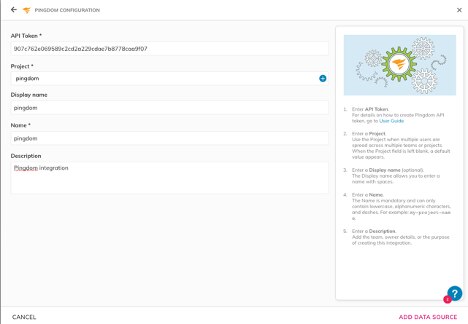
On the configuration page, enter your Pingdom API token. Then, select the project you want the data source to be part of. This can be the same project you created earlier when adding the service. Next, add a friendly display name and an optional description. The Name field will be populated automatically. When you’re done, click “Add Data Source.”
Setting Up a Pingdom SLO
To set up your first Pingdom SLO, you’ll need the monitoring check ID. You can retrieve this by following these steps:
- Log in to Pingdom and navigate to Synthetics -> Uptime.
- Click on the site name you created.
- Copy the check ID, which will be displayed in the URL in your browser’s address bar. It should look something like this: https://my.pingdom.com/app/reports/uptime#check=9681170.
Inside Nobl9, navigate to the SLO grid view and click the “+” to create a new SLO. Follow these steps in the wizard:
- Select the service you created earlier.
- Select the Pingdom data source you added, then select “Uptime” and enter the check ID. Set the Status field to “Up.”
- Set the time window to “Rolling.” This will reset the error budget in the time window you care about. In most cases, customers use a 28-day rolling window.
- This step is where you set your objective. Set the target to your reliability goal (for example, 99%). Set the experience name to “Good,” and set the desired value to less than 2,000 (i.e., 2,000 milliseconds). Of course, you can adjust these settings to match your expectations. You can also add additional objectives, such as a “Bad” experience with a 99.99% reliability target of less than 5,000 milliseconds.
- Add a friendly display name for your SLO. We haven’t set up alert policies yet, but this is also where you can add your alert policies, labels for the SLO, a link to the SLO details, and a description of the SLO. These are all optional.
When you’re done, click “Create SLO” to create your first SLO.
If you went with a 28-day rolling window, it’ll take a few minutes for Nobl9 to get enough data points to plot the graph and show data in the SLO grid view.
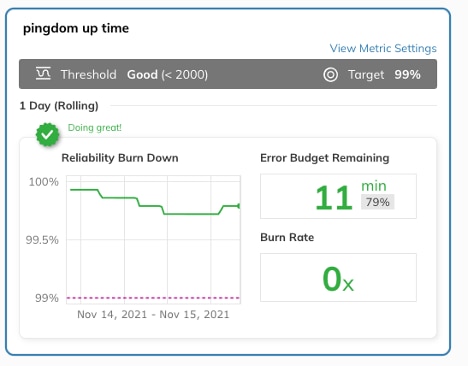
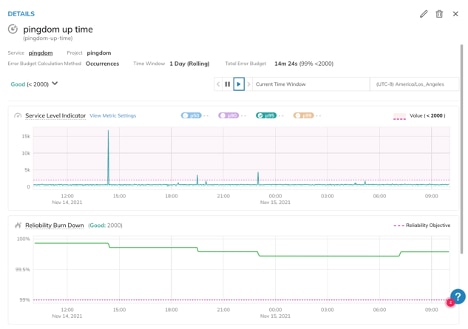
Once everything is working, you’ll be able to go to the SLO details page and see your SLO in action.
If you run into any issues along the way, check out the Nobl9 documentation on creating SLOs.
Summary
You can create as many SLOs as you need, and the integration between Pingdom and Nobl9 makes it easy for you to monitor them, add alerts to them, and generate reports on them.
As you can see, it only takes a few minutes to set up Nobl9 and Pingdom to start monitoring your website and build an SLO around it. If you want to try this for yourself and haven’t used Pingdom or Nobl9 before, sign up for a free Pingdom trial and a Nobl9 trial. To learn more about each tool, check out these links:


