


To stay alive and growing, tech organizations are always on the hunt for ways to increase the quality and stability of their applications and services. Doing so is essential if they want to prevent their customers from becoming their competitors’ customers, after all. This post is all about a specific process organizations can—and should—use to increase the availability and performance of their offerings and delight their customers: application performance management (APM).
To discern the differences between the APM solutions on the market, you need to have a good understanding of the problem it solves. So before going into APM itself, I’ll cover application performance and explain why it’s so critical.
Afterward, you’ll be ready for the main part of the post, which covers APM itself. I’ll start by defining the concept and explaining how it works. Then, I’ll cover several things you need in a comprehensive APM strategy. Before wrapping up with some final thoughts, I’ll list some of the most important features APM tools should have. By the end of the post, you’ll understand the fundamentals of APM, why it’s needed, and how it works.
Application Performance Management: Starting With the Fundamentals
Before we move to the solution, let’s make sure we’re on the same page when it comes to the problem.
How Do We Define Application Performance?
Every application takes a certain amount of time to perform the task it’s supposed to perform, whether its loading a page or performing a critical transaction. Additionally, every application consumes resources—e.g., memory, disk, processing power—to power each user experience. So, we can say performance is about defining how fast an application is, how efficiently an application does its job, and how satisfied the end user is with the application.
The Importance of Application Performance
We’ve just defined application performance, but when it comes to web applications, performance is much more than infrastructure resources and application code. We must go beyond this definition and instead understand performance from the end-user perspective.
Application performance is important because poor performance drives users away. It makes them less likely to come back, and it makes the users who do stay less likely to buy your services or products. Poor performance hurts your organization’s reputation and its bottom line.
Application Performance Management to the Rescue
If poor application performance can hurt an organization in a variety of ways, then great performance keeps your business running smoothly and has a positive impact on your business. Organizations should leverage every weapon they have to improve the performance of their apps and services, which is where a process like APM comes in handy.
Defining Application Performance Management
We can define APM as the process of monitoring how applications behave and respond to users’ requests. By using APM, you can measure how fast transactions happen in an application, see how the application responds to requests performed by end users, and measure how “healthy” the infrastructure supporting the application is.
Doing so allows organizations to diagnose infrastructure and application issues and fix them. It also enables you to identify trends potentially resulting in future issues, so you can prevent them before they impact your users.
Additionally, all this monitoring can help organizations obtain insights they can use to make better decisions, avoid future problems, and ensure their applications perform the best they can.
How Does Application Performance Management Work?
In practical terms, organizations perform application performance management by adopting a tool or set of tools and putting them to work.
These tools can continuously monitor the availability, speed, reliability, and overall user experience of applications. By tracking and improving important metrics, they can diagnose issues and uncover opportunities for improvement.
But APM doesn’t live on metrics alone—quite the opposite. A comprehensive APM strategy should include several different tactics or components.
The Different Components of a Comprehensive APM Strategy
I recently mentioned metrics, but there are several components in a well-rounded application performance management strategy. Monitoring plays a big role in all its different flavors (i.e., real user monitoring and synthetic monitoring). Besides tracking metrics, analyzing logs, traces, and end-user data should be an invaluable part of your APM strategy to maximize your observability.
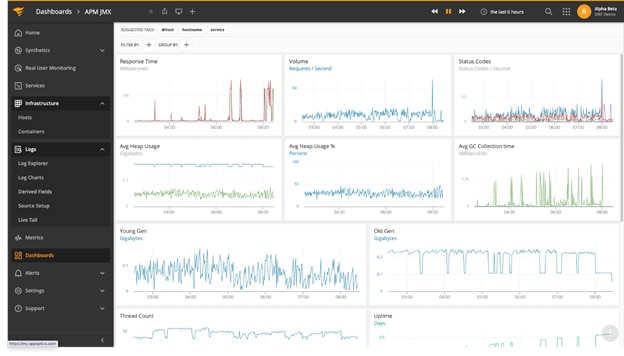
Metrics
Metrics are time series measurements you can use to monitor trends. As such, they can provide a general, high-level view of your application’s performance.
It’s essential to monitor app-related metrics such as error rate and time latency. However, you also need to monitor metrics related to the infrastructure supporting the software systems, whether it’s the underlying “metal” infrastructure or the supporting virtual infrastructure (virtual machines, containers, etc.).
Tracking metrics can help organizations identify trends and potentially prevent problems before they happen. For instance, you can use the metrics you read to figure out what an application’s baseline performance is. With this knowledge, you can set up alerts to trigger when metrics are outside the norm to help prevent issues.
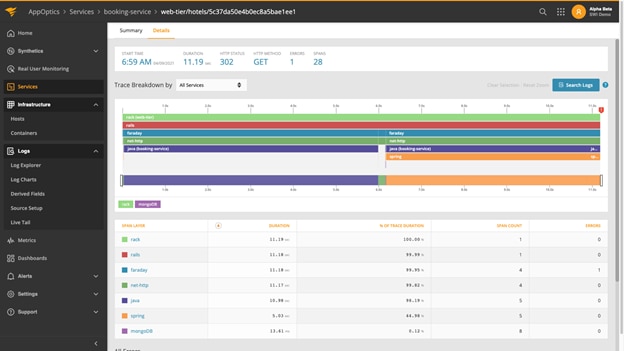
Traces
Traces follow a single request as it goes through the many layers of an application.
Since they span multiple services, monitoring traces can provide organizations with priceless information. You can learn how much time the request spent in each service and which parts of the infrastructure were exercised by each stage of the request. With this knowledge, you can find out about bottlenecks in specific areas of the infrastructure or layers of the application. This server-side data helps you understand if users are experiencing an issue, why the issue is occurring, and where the issue is occurring within the application.
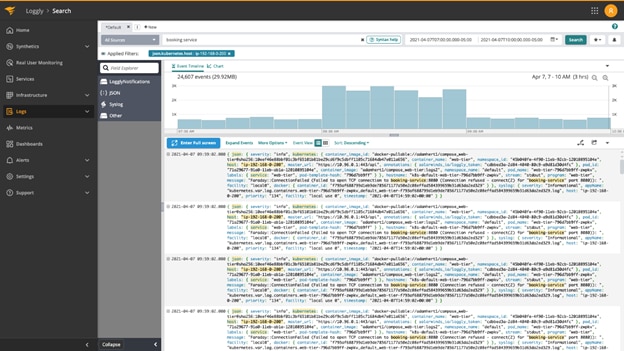
Logs
If your application goes down, logs are essential to troubleshoot the problem. Two common types of logs are system logs, such as the ones generated by a database’s system of infrastructure components, and custom log events, which are added by developers when they work on their applications. Both give broader context to error-related messages regarding your application’s performance and insight into the implications of server-side performance on user experience.
Because logs provide invaluable information for diagnosing, fixing, and even preventing issues, it’s essential for you to leverage their power by making a log management/log analysis approach part of your overall APM strategy.
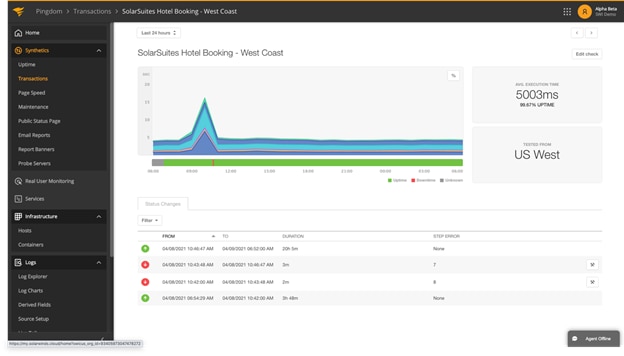
User Experience
Earlier, I mentioned how vital it is to adopt a more user-centric view of application performance. This ties in perfectly with the last item on our list of APM components: user experience—or, more specifically, end-user experience monitoring.
End-user experience monitoring—both its real and synthetic versions—is an essential part of APM. You can’t get more real than real, and real user monitoring offers the opportunity to obtain insights into real user behaviors you can’t get anywhere else. By contrast, synthetic monitoring lets you test scenarios without the need to wait for real customers to exercise them. This allows you to be proactive and ensure your business-critical transactions in the web application work as intended.
APM Integrated Experience: The Best Application Performance Management Flavor
In this post, I’ve offered an introduction to APM. You’ve read about performance and why it matters so much. You’ve also learned what application performance management is, how it works, and what some of its main components are.
APM is an umbrella term under which many different approaches live. In other words, APM can assume different flavors. Different vendors have different views on what APM means, and as such, they create tools designed to cater to the problems they think are most important.
Experience has shown, though, an integrated approach works better. Metrics are great, and so are logs. Traces can help organizations learn a lot about their apps and infrastructure. The same can be said about end-user experience monitoring.
However, these approaches really shine when you combine them all in a single platform, which SolarWinds has done with the SolarWinds® APM Integrated Experience. With the degree of visibility the APM Integrated Experience offers, you can discover and fix problems in a much faster and easier way, obtain insights capable of informing decision-making, and prevent further problems in the future. The APM Integrated Experience is designed for simplicity and collaboration so anyone—from digital marketing team members to developers—can leverage the tools to understand their application, troubleshoot when needed, and optimize performance.
Take your first step into your APM journey with client-side visibility. Sign up for a free trial of SolarWinds Pingdom® today.
Want to dig deeper? Explore the latest insights from the Gartner® Magic Quadrant™ for Observability Platforms by clicking here.
This post was written by Carlos Schults. Carlos is a consultant and software engineer with experience in desktop, web, and mobile development. Though his primary language is C#, he has experience with a number of languages and platforms. His main interests include automated testing, version control, and code quality.


