


We’ve been listening to our customers. Whether you’re a SolarWinds® Loggly®, SolarWinds AppOptics™, or SolarWinds Pingdom® user, we’ve been working hard to make your life easier. We’re happy to announce a brand-new experience designed to bring together real user monitoring, synthetic transactions, metrics, traces, and logs in a single platform, making it faster and easier to identify, triage, and troubleshoot application issues.
End-to-End Observability for Everyone
Applications are critical to the success of organizations today. If end users can’t successfully interact with applications, it can have a significant negative impact on the business. To keep applications running properly, we need to be able to identify user facing issues, triage them appropriately, and then troubleshoot the issue and ship a solution.
Let’s look at how we can use five different data types to reduce downtime in applications, and in turn reduce the risk to the business.
Real User Monitoring
This data is collected through a JavaScript snippet in the browser. The JavaScript is executed by the end user’s browser and provides insight into performance by page and geographic region, and performance broken down by time spent waiting on the network, server, and browser.
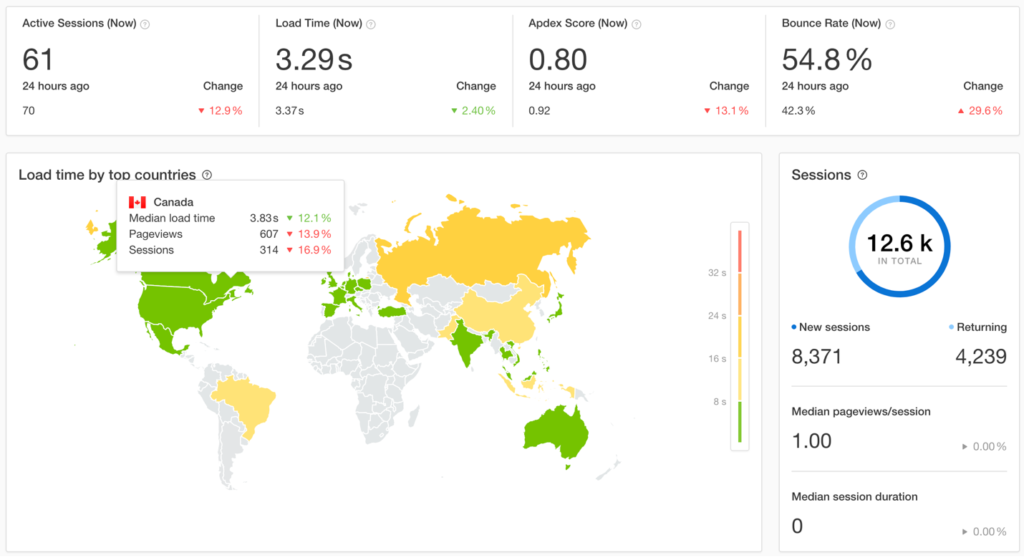
Real user monitoring data helps identify user facing performance issues in real time, and then further helps us triage by understanding if the issue is only affecting some endpoints, some regions, and which teams we need to involve to troubleshoot the issue (network, infrastructure/SRE, or web team).
Synthetic Transactions
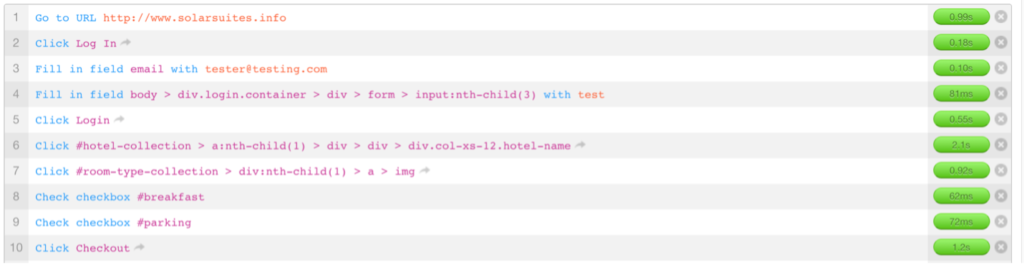
Synthetic data complements real user data by removing variables. Synthetic monitoring is a simulated test that can validate availability and performance of web application endpoints and critical pages and site flows. All of them run from probes around the world and execute at a set interval. For example, we may set up a transaction test to run repeatedly on a specific interval to log in to a site, add an item to a cart, and then checkout. If this transaction fails, we know it’s not due to user error or edge cases, it’s a fundamental problem in our application.
Metrics
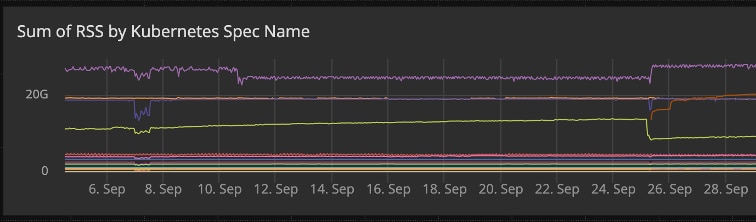
These are time-series measurements used to monitor trends and deliver a high-level view into application performance. Key metrics include response time latency, error rate, request volume, and resource consumption metrics of the underlying infrastructure such as CPU and memory utilization. It’s also important to monitor other resource metrics on the supporting infrastructure, such as CPU saturation in containers, virtual machines, and databases. Queue lengths are another important metric to watch in more complex data pipelines to monitor for backpressure that can eventually lead to slowdown, data loss, or other production issues.
Traces
Traces contain detailed information about a specific request. Traces can span multiple services and containers and show information such as the resource requested, how long the request took, where it spent its time (down to the function in each service), and which parts of the infrastructure were dependent on the request. Traces can now be directly linked with logs as well to quickly have full context without guessing for related events.
Logs
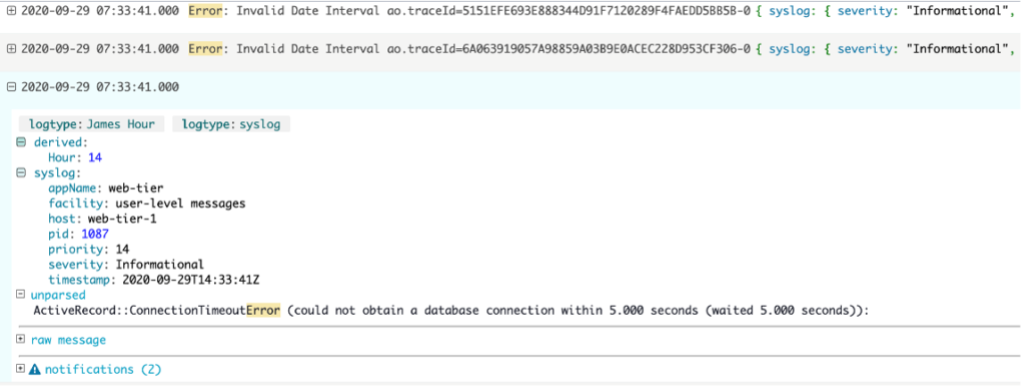
Logs and events contain rich information to help us get a full understanding of an issue. Default log messages generated by applications and associated infrastructure are useful to identify glaring errors, resource constraints such as thread exhaustion in an application, or timeouts from a database. The custom logging developers add to their applications is priceless. It’s good practice to handle exceptions in an application and log a message of possible causes when you’re developing the application. This allows operations teams to gain context from the developer when solving issues even years down the road.
How Does It Work?
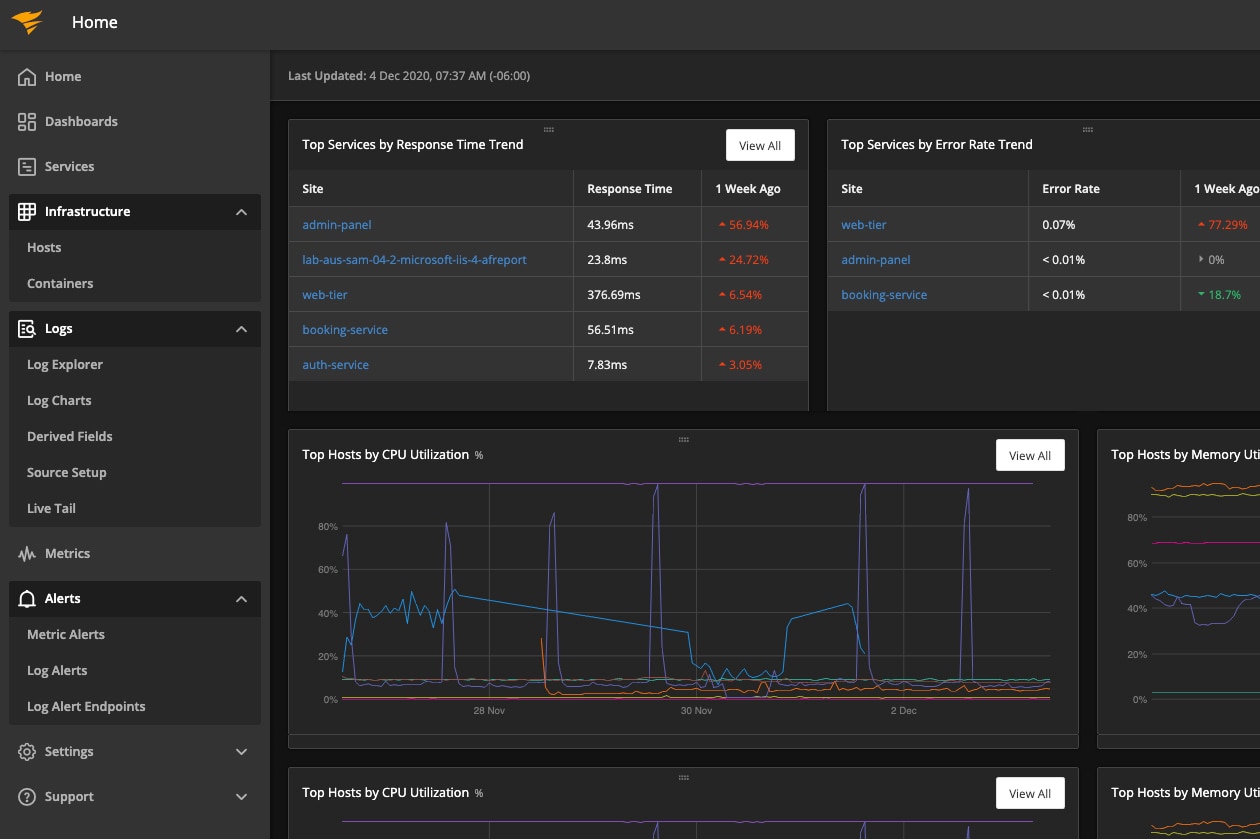
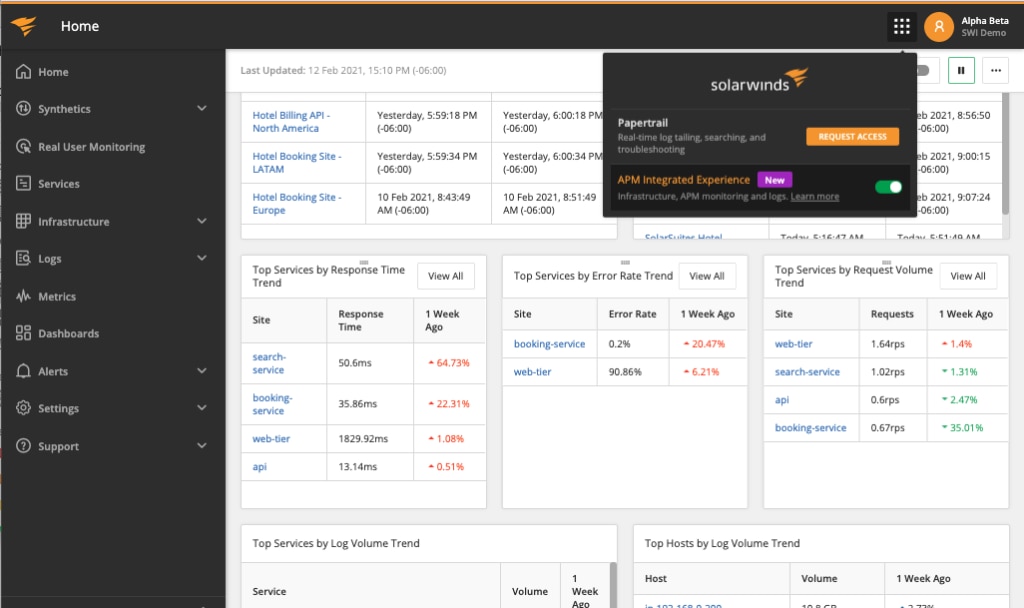
The new APM Integrated Experience brings together Pingdom, AppOptics, and Loggly, so metrics, traces, logs, and user experience insights can be viewed using a single interface. To turn on the new experience, toggle the button seen below.
After toggling the button, the main navigation on the left will be updated to include the following items:
- Home – A new landing page with a high-level view of what’s changed in the last week and what could be an issue
- Synthetics – Uptime checks and scripted transactions
- Real User Monitoring – Performance by region, device, and component
- Services – APM data containing summary views and detailed distributed traces
- Infrastructure – Lists for hosts and containers, plugins for web servers and databases, and direct integrations for AWS and Azure
- Logs – Advanced searching capabilities on structured logs and a Dynamic Field Explorer™
- Metrics – Explore monitored time series; helpful for rapid troubleshooting
- Dashboards – Dashboards for both metrics and logs
- Alerts
This Sounds Great, But How Do I Use This in the Real World?
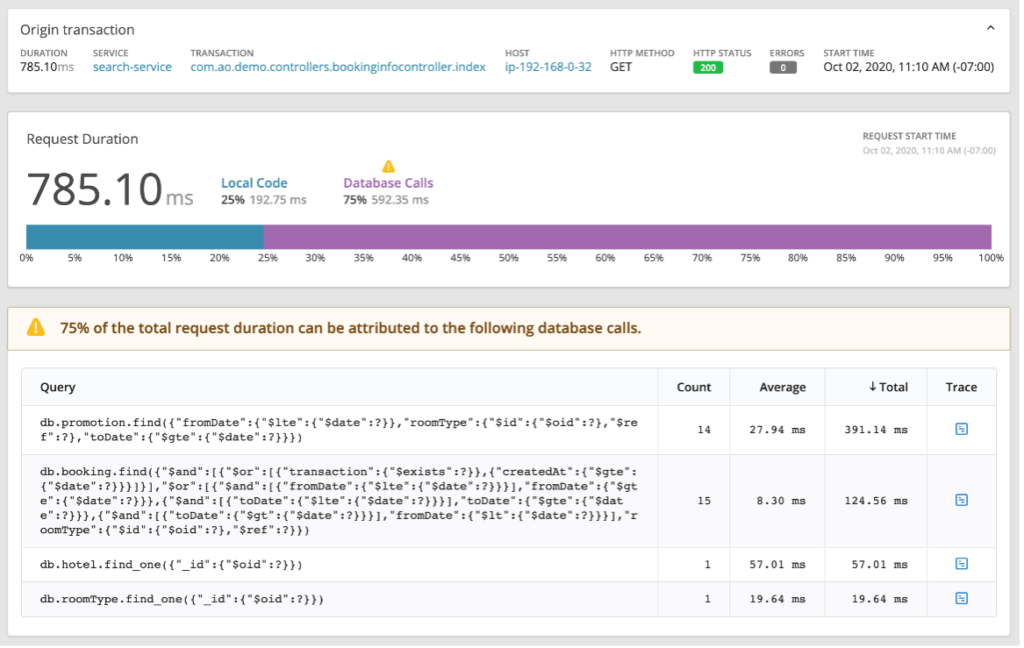
Application performance issues are often caused by the underlying database, so let’s walk through an example of how we can catch application-impacting common database issues and quickly understand their impact.
Example situation:
Database is returning “MySQL has gone away” because the server is under too much load and queries are timing out.
In this situation, the latency for applications making queries to this database would’ve already increased as the latency due to slow queries increased. This increased application latency could have triggered an alert, and looking at associated traces would show the database was the underlying bottleneck. We could then look at the CPU and memory metrics for the database to understand it was under too much load. Using this information, this incident could have been prevented before any requests errored due to the database timeouts.
If we didn’t catch the issue using metrics, we would start to see failed synthetic transactions and errors in real user data across all regions.
How Do I Try It?
If you’re an existing AppOptics, Loggly, or Pingdom user, use the app switcher in the top right to activate the new experience as seen below.

If you aren’t using SolarWinds monitoring products yet, sign up for a trial here. Want to dig deeper? Explore the latest insights from the Gartner® Magic Quadrant™ for Observability Platforms by clicking here.


