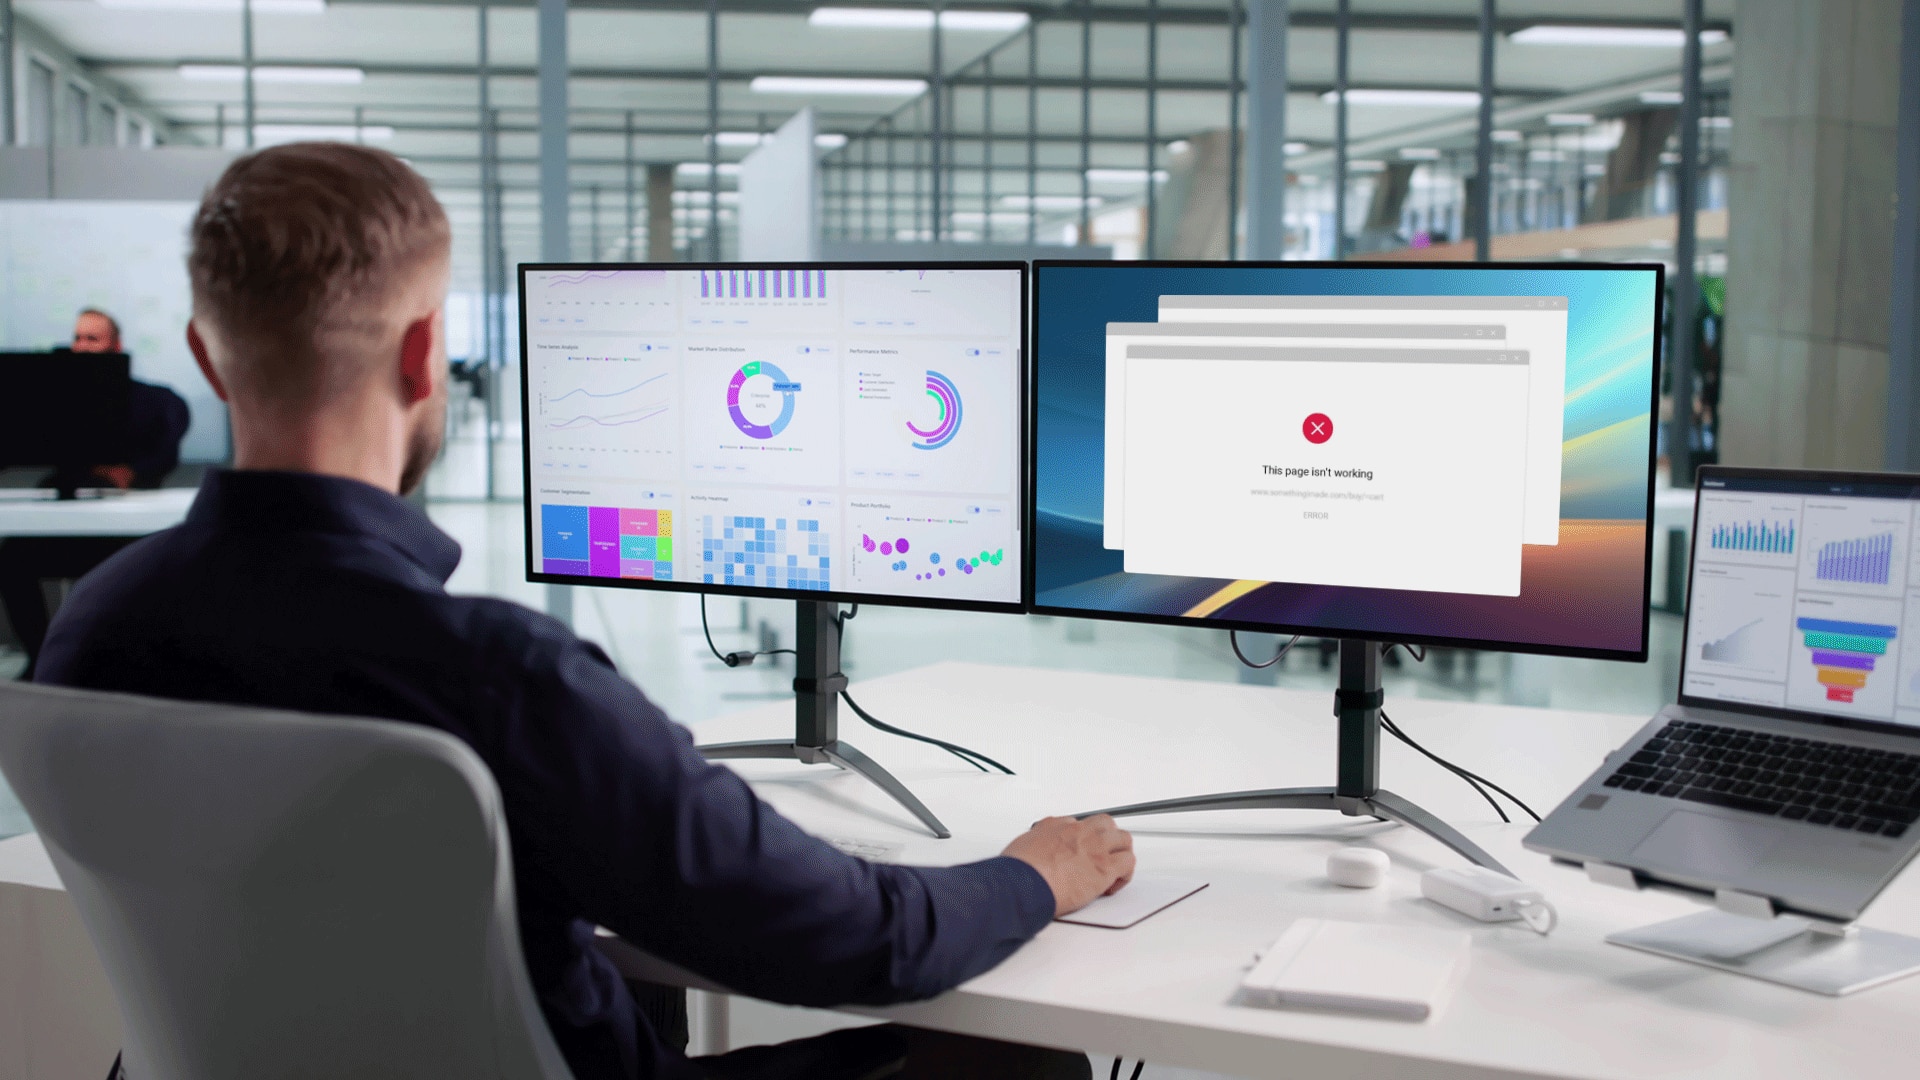
In the last decade, businesses have made massive investments in the digital economy with the goal of increasing operational efficiency and improving their customer or end-user experience. However, it isn’t rare for businesses to incur losses due to poor page load speed, failed transactions, or website errors. This is why businesses need to track end-user experience in real time and resolve issues quickly. But because web applications depend on numerous third-party APIs, JavaScript and CSS components, hosting servers, and networking components, tracking every component and finding the root cause of issues can be a complex challenge. This is where digital experience monitoring (DEM) tools can help. DEM refers to emerging tools and techniques designed to help track user experience and performance issues by collecting and analyzing data from websites and applications from the user’s perspective. It includes both synthetic monitoring and real user monitoring (RUM).
How DEM Helps Troubleshoot End-User Experience Issues
Let’s discuss how DEM tools simplify and expedite the detection and troubleshooting of website performance issues to improve the end-user experience.
Tracking Website Outages
Organizations need to be on top of their websites’ availability across all business-critical regions to ensure they can serve their customers 24/7. If a website outage remains undetected, it can lead to severe reputational and financial losses. Website administrators used to rely on the traditional ping utility to check response times and detect issues with website availability. However, modern DEM tools automate ping tests and alerts and assist in root cause analysis. With a DEM tool, organizations can configure the frequency of ping tests and track their websites’ uptime from different servers across the world. If they detect an outage, administrators need to drill down and find out whether it’s a coding error, DNS resolution problem, networking issue, or server issue with their web hosting provider. They also need to be proactive in communicating the outage to their end users. DEM tools can display a public status page with details of expected downtime. With regular uptime monitoring, organizations can ensure their website delivers a consistent experience to customers across all regions.
Monitoring Page Speed Issues
Modern websites have pages with several HTML, JavaScript, and CSS components along with images and videos. When a webpage loads all these components, it creates requests, which sometimes can slow down a website. Website administrators need to constantly monitor the performance of these components to detect whether any of them are behaving abnormally or taking longer than usual to load. DEM tools offer advanced page speed monitoring features designed to help capture the file sizes, load times, and other relevant details about page elements to detect which component or content piece is impacting page performance. Granular metrics and visualization make root cause analysis simpler. DEM tools also provide recommendations to improve test scores. Additionally, organizations can get a filmstrip timeline view of the page load performance to get a better sense of how a page loads. This helps them make informed decisions regarding minification of code, compression of images, implementation of lazy load, and more to improve the real and perceived end-user experience.
Resolving Critical Website Errors
Sometimes websites throw error messages, which can annoy end users. However, the error codes can be useful for web administrators to troubleshoot issues. For instance, missing content on a website can trigger a “404, page not found” error message. Such pages are common, as businesses have to redact or unpublish their outdated pages from time to time. At times, migrating a website to a new CMS or domain can also lead to 404 errors.
Similarly, users often receive internal server errors (500) potentially caused by a range of issues within the website. DEM tools help administrators capture these errors over a period to identify trends such as peak traffic triggering such issues. A 503 error code generally indicates website congestion, which could be due to increased genuine traffic or a malicious attack. If such errors are frequent, teams can dig deep to assess their security and consider investing in content delivery networks. With CDN nodes reducing the load on the central host server, a website is less likely to show 503 error codes. Tracking and resolving such website errors in near-real time is crucial, and digital experience monitoring can help with this. With DEM tools, admins can get notified about errors like these through email, Slack, SMS, or any other preferred medium.
Synthetic Transaction Monitoring
While real user monitoring techniques are useful for keeping track of production issues difficult to replicate in test or staging environments, developers can also detect such issues in production using synthetic transaction monitoring. This involves running test scripts in the production environment on a predefined frequency to surface issues with critical transactions or website workflows such as logins, filling and submitting a form, adding items to a shopping cart, etc. Synthetic transaction monitoring allows admins and developers to detect issues before their end users encounter them. DEM tools make transaction monitoring simpler for admins by providing out-of-the-box code snippets to check critical transactions and no-code transaction recording features. With these tools, it’s possible to set up transaction checks and alerts for certain keyword matches on critical pages. With this, admins can detect known error messages or ensure a URL redirects to the right page.
Conclusion
We’ve discussed how businesses can improve their end-user experience using real user monitoring and synthetic monitoring techniques. Though most businesses partially employ these techniques, they lack a holistic view of their website performance and user experience.
DEM tools like SolarWinds® Pingdom® can bridge this gap, helping them gain deeper insight into the user experience with correlated visibility into their websites’ real-world performance issues. We recommend a 30-day free trial to learn more about the SolarWinds Pingdom DEM tool and its benefits.
Want to dig deeper? Explore the latest insights from the Gartner® Magic Quadrant™ for Observability Platforms by clicking here.


