


You can think about your web site the way you think about your car. Every time something breaks, you can run to a professional – be it an engineer or a mechanic – and pay a lot of money for the fix (and isn’t it annoying when you can’t even tell if it is a big fix or small?), or you can learn some basics, get a few inexpensive tools, and troubleshoot many of the immediate issues yourself.
The truth is that web performance issues are relatively easy to understand once translated into plain English. You could, of course, read Richard Stevens, or try Wikipedia’s infamously complex IT-related repositories, but the reality is that you don’t need more than a few basic concepts to be able to tell what went wrong with your web site and why.
With that in mind, let’s start from the beginning: understanding where your web site is in the big (internet) picture.
DNS – It’s Just a Phone Book
[Note: if you are familiar with DNS, skip right along to the Traceroute section]
Your web site and all its pages live on a web server somewhere. When your web site is down, the first thing you’ll want to know is if the problem is close to home (aka, on your web server) – and thus possibly under your control – or if it’s somewhere else on the network.
How is your web server found on the internet? Basically, every machine has an address that uniquely identifies it on the internet. It’s a four-part number like 68.142.254.15, and it is, as you already likely know, called an IP address. When computers communicate they use IP addresses exclusively. However, because these large numbers are not as convenient for humans, a convention was created for matching each IP address to a human-readable name – a domain name.
When you type a URL in a browser, for instance www.google.com, your computer uses what is called DNS or Domain Name System to translate www.google.com into the IP address, in this case 74.125.239.146. DNS is often compared to a phone book, in which every computer has a (domain) name and a (IP) number associated with it.
Now that we know what an IP address and DNS are, let’s bring up another very common term: host. A host is a computer or other device connected to the internet, aka a machine that is a part of the Domain Name System. It is worth mentioning here that domains contain hostnames: a fully qualified host name is comprised of a machine name and the domain name, e.g., games.yahoo.com. This gets a tad more complicated, but for our purposes, a slight oversimplification is perfectly fine: think of DNS as a phone book for every machine on the internet, containing its domain name and a corresponding IP address.
The first step in figuring out why your website is down, then, is making sure that the domain name matches an IP address, aka that your domain name is listed in the DNS “phone book” (for various reasons, just like a phone book, DNS is often not up to date). This is referred to as “resolving the IP address”, and it’s a good first step on your web diagnostics path.
If resolving the IP address takes too long, it can mean a variety of things, but without going into technical details, you can assume that you have isolated a very likely cause of your website down time. This is where you’ll need to contact your web hosting company or system administrator to resolve the issue.
Traceroute – The Internet’s Traffic Report
Another possible reason why your web site is not available to users: somewhere along the path from their computer to your web server there is a bottleneck or an outage. Investigating the location of the outage is important so that you can understand the gravity of the issue, when it is likely to be resolved, and what you can communicate to your users.
Now, how to locate the bottleneck?
The internet is a network of laptops, desktops, servers, routers, switches, mobiles devices… basically computers, or, as we learned to call them, hosts, each of which has an IP address and is discoverable via DNS. We can imagine every one of these devices as a node in the network, with information traveling across the network from node to node – much like a person might drive from one city to the next on a road system. And just like a person cannot drive from Los Angeles to New York without traveling through many other cities, so data must travel across many network paths and routers in order to reach its destination.

While tracing the problem across this many routes may seem complicated, the great news is that there is a standard utility/command that’s available on operating systems of all these machines, and it’s called – if you have not yet guessed – traceroute. Traceroute traverses the network, and reports back on information transit times, much like a traffic report does.
How Traceroute Works
Information travels across the internet in small packets, which go from source machine to destination machine through many nodes along the way. For example, for you to be able to see your web site, data packets from your web server have to be able to reach your computer.
To find out which node might have blocked the way of the data packets, traceroute maps out nodes along the path from your computer to the web server. It maps the route one node at a time, and records each of the “hops” to a node on your screen. Each row gives you the node information and IP address, as well as the time it took for a data packet to get to the node and back to your computer:
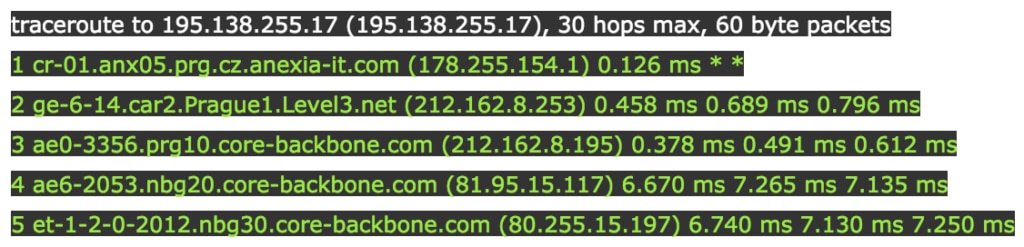
By measuring the total round trip time the data packet took to travel between your computer and a node, traceroute measures the health of the said connection. If the total time recorded on any of these rows is too long compared to your expectations, you know you have found the culprit node.
Occasionally, in lieu of a row with helpful information, you’ll get a row of three stars:
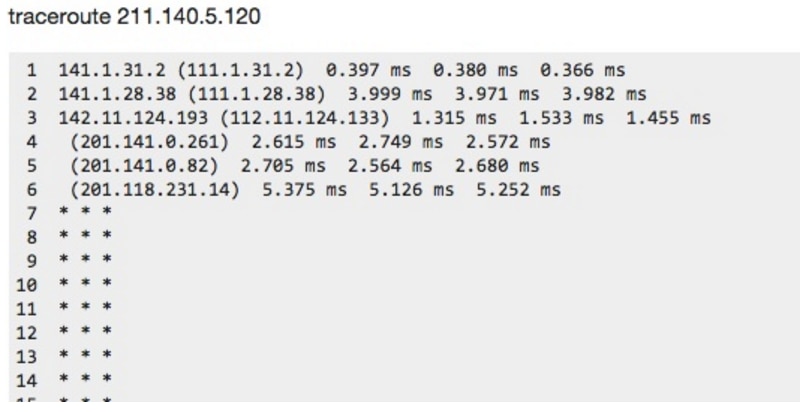
This usually means that the node is behind a firewall, aka purposefully “hidden” by the company or individual who owns it. If traceroute returns a few such rows, and continues tracing the path within a minimal timeframe, you can continue your analysis as is. If the time between the node before the “starred” lines and the node after is too long, your culprit just might be the server behind the firewall.
You may be wondering how traceroute knows where to stop going to more nodes, aka knows that it has reached the destination node (your web site’s server). Each of the data packets traceroute sends contains source and destination information, and once the destination information matches that of a node, the search is over and traceroute stops. In addition, behind the one-at-a-time node “hopping” and coming back, there is a counter system of sorts called TTL, or time-to-live, but there is no need to get into that much detail here.
For us, what matters is that traceroute will show us the health of each machine along the path from our machine to the web server. Furthermore, using simple online or operating system tools, you can find out geographical information about each node. Let’s say that the majority of your customers are in North America. If you find out that your web performance is affected because a major server in Prague is down, you may not be as concerned as you would be in case of a server outage in Virginia.
More Testing = Better Results
Now that you understand how traceroute works, you also understand how it can help you understand where your network path broke down. However, you’d be right to ask how this helps you if you are the owner of a website with millions of users/customers in different places all over the world. Won’t all the paths from their computers to your web server be different? And if so, how would you test all those paths?
The simple answer is that you ought to perform traceroute tests from many different spots around the world. While this would indeed be an overwhelming tasks for each individual or company with a web site, companies like Pingdom scale these types of operations. They provide online tools that perform these operations for you for a nominal monthly fee. They have networks of many machines all around the world that will perform DNS and traceroute tests at scale, and as often as every minute.
To see how you can utilize all of your newly acquired knowledge of DNS and traceroute in one easy-to-use dashboard, check out Pingdom’s blog post and tutorial on root cause analysis, and stay tuned to this space for more information on web performance and its aspects.
About the author
Ivana Ivanovic is the Content Marketing Manager at Pingdom’s sister company, Librato. She comes to content marketing with a passion for language, a knack for all things technical, and a background in business. She loves to read, dance, sail, and squabble over grammar and style. More on www.ivanasays.com and Twitter.


