Pour some RUM on your website
Synthetic monitoring will find what you have “asked” it to find. But that’s it. If you’re not monitoring using a certain browser or from a specific location, you won’t find issues that are related to that browser or location. Real User Monitoring (RUM), however, will do just that.
RUM completes the monitoring spectrum, enabling you to take targeted action and remove performance inhibitors. This puts you in a better position to commit to customer demands, marketing strategies and business revenue objectives.
Spread more happiness
Since RUM is such an important way of tracking performance of your website visitors, here’s a walk-through to help you improve your business.
Using RUM, you’ll get:
- Performance metrics to tell you if your visitors are happy or not
- Performance overview from where to find possible issues to investigate
- Real world performance conditions – such as browsers, network, latency, packet loss, firewall issues, geographic location, connection type and speed
- Complete data for all visitors and all page loads of your site
In general, RUM works at an overview level. It doesn’t provide you with all the details that might be needed to actually solve an issue. Its strength is that it examines everything an actual visitor is seeing, so consider it as broad but not very deep monitoring. It’s a great way to find issues other monitoring might be missing and to give an indication on where to look further to find the root-cause of the issue. Read more here on how you can make synthetic monitoring and RUM work together.
Examine your website performance
When looking at performance metrics, it’s best to look at medians instead of averages. Medians takes outliers better into account so the value doesn’t get skewed too much. You can easily select if you want to show average or median in the RUM reports.
Countries
In the countries report, you can see the performance from different countries. This is based on number of visits per country as default so you will see performance from the countries where you have the most visitors. With this data, you can find out if you should investigate some countries in more detail.
Things that can affect the country performance:
- Geography – What is the distance to your main server(s)?
- Connectivity – How is the infrastructure of the country? Are they using mobile connections to a large extent?
- Peering – How does traffic get routed? Even though it’s geographically close, the traffic might take strange detours which affects performance.
- Technology usage – What kind of computers are common in the country and which browser do people use?
Pages
The pages report shows you the performance for individual pages on your website. So this is where you can find specific pages that doesn’t perform well, for example a page that loads an external widget that affects the load time in a negative way.
Browsers
Browsers behave slightly different and can affect performance so it makes sense to look at the performance based on what browser your visitors are using.
Have in mind that:
- Mobile and desktop browsers are different, even the same browsers.
- All browsers doesn’t support the navigation timing API which is used for RUM.
- Bugs in specific versions of browsers can have a negative performance impact.
Experience
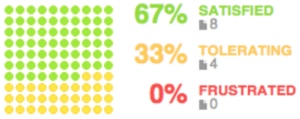
When just looking at a median you should think of that there are always outliers and visitors which has a worse experience than others. Just seeing that 10% of your visitors are considered frustrated makes you aware of this fact and you can make a plan on if and/or how you should make improvements for this group.
APDEX was created so you easily can see the performance for your visitors without having to look at, for example, the median load time. The basic idea is to divide your users into three groups; frustrated, tolerating and satisfied.
Setting up APDEX in Pingdom is easy since all you have to do is to set the threshold for within which time the site should load for a visitor to be satisfied. Most commonly this is set to 3-4 seconds.
When tracking many users, you can either look at the percentages in these groups or a general APDEX number – which goes from 0 to 1. The scale has five groups; excellent, good, fair, poor and unacceptable.

States
The states report shows details of the phases that takes place when loading a web page. Normally most time is spent during the front-end phase when images and objects are loaded for the page to work and the page is rendered in the browser.
It’s also interesting to look at the back-end phase, usually very short but if it stands out, this can indicate issues with the web server that is delivering the pages.
Another common issue is DNS (which usually just takes milliseconds). It could affect performance and overall reachability severely. Read more here.
Customers who hate slow websites will love RUM
A few things to note about RUM is that the larger site you have, the better data you’ll get. For a small site, one visitor with issues can skew the data which you always should take into account.
Another thing to keep in mind is how the data is collected. Modern browsers doesn’t have any issues but older browsers doesn’t support the technology that provide RUM with accurate data. They rely on a custom work-around which is far from perfect, but gives a good indication.
“Time you enjoy wasting is not wasted time.”
Oscar Wilde
You are really getting the load time of all your visitors to your website and the load time for all the pages that they visited on the site as long as you installed the small Javascript-snippet correctly.
When your web experience is rooted in your business strategy and you constantly monitor, fine-tune and optimize your site – it will be a capable revenue driver. Synthetic monitoring and RUM working together will provide you with the metrics that matter most.


