 The iPad has made a huge splash in a very short time, and this in spite of only being available in the United States. Now that its release in other countries is getting closer every day, where is anticipation the hottest? Which countries are the most interested in the iPad?
This is one area where Google can come to the rescue of Apple (something we haven’t seen much of lately). Google Insights for Search can show the “regional interest” for various terms. When a brand name is involved, like the iPad, it becomes very useful since it will be same all over the world and will reflect interest in that brand or product. We used this tool to research the overall global interest in the iPad, and also where in the United States it’s most popular.
To make sure that this survey is as up to date as possible, we only used data from the last 30 days, i.e. from the week before the iPad launch until today.
Worldwide interest in the iPad
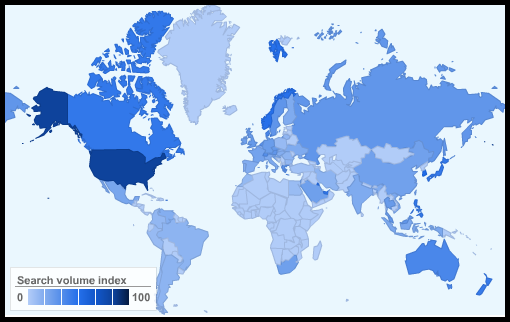
With the exception of the US, you’d be hard pressed to correctly guess where the interest in the iPad is the highest. The results are far from obvious, as you will see.

Above: Interest in iPad, region by region, worldwide, the last 30 days.
Top 10 countries in terms of iPad interest
- United States
- Hong Kong
- Singapore
- Puerto Rico
- South Korea
- Taiwan
- Kuwait
- Norway
- United Arab Emirates
- Philippines
(Yes, we know Hong Kong isn’t a country per se, but Google lists it as its own “region”.)
USA is at the top here, which shouldn’t be a surprise considering it’s the only place the device has actually launched so far.
A closer look at interest in the iPad inside the US
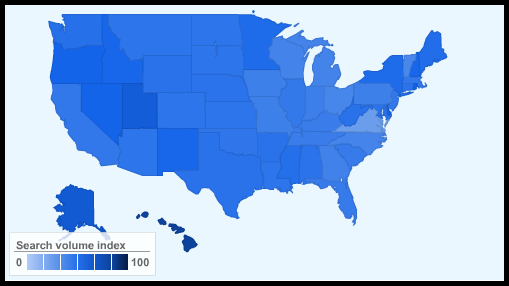
Now that the iPad has successfully launched in the United States, where has the device become most popular, or to be more precise in this case, where has it generated the most interest?

Above: Interest in iPad, state by state, USA, the last 30 days.
Top 10 US states in terms of iPad interest
- Hawaii
- Alaska
- Utah
- Delaware
- Rhode island
- Oregon
- Nevada
- New Mexico
- New Hampshire
- Idaho
Yes, that’s right. The iPad has apparently garnered a huge amount of interest from the people of Hawaii.
Aloha.
It’s interesting that the two “extremes” (in terms of climate) of Hawaii and Alaska are the two top US regions in terms of iPad interest. Talk about polar opposites.
Looking just at cities the top result is a bit more predictable, with the Silicon Valley-infused San Francisco leading the pack.
Top 10 US cities in terms of iPad interest
- San Francisco
- Pleasanton
- Minneapolis
- Austin
- New York
- San Diego
- Denver
- Boston
- Los Angeles
- Seattle
Final words
These are the results for now…
Once the iPad has been launched in the rest of the world and Apple’s marketing machine has pumped up the iPad buzz in those regions to an even greater degree than today, the results of this survey may change a lot.
It’s no secret that many countries outside the US have a lot of people who eagerly await their chance to try out the iPad. So much, in fact, that many won’t even wait until it’s officially launched. For example, we have an imported iPad here in the Pingdom office, and we know of several people among our friends here in Sweden that already have one.
Note: All these values from Google are normalized, i.e. they are adjusted depending on the size of the population (or number of searches). In this case you can think of it as interest relative to population size.


