Synthetic Monitoring

Simulate visitor interaction with your site to monitor the end user experience.

View Product Info

FEATURES

Simulate visitor interaction

Identify bottlenecks and speed up your website.

Learn More

Real User Monitoring

Enhance your site performance with data from actual site visitors

View Product Info

FEATURES

Real user insights in real time

Know how your site or web app is performing with real user insights

Learn More

Infrastructure Monitoring Powered by SolarWinds AppOptics

Instant visibility into servers, virtual hosts, and containerized environments

View Infrastructure Monitoring Info
Comprehensive set of turnkey infrastructure integrations

Including dozens of AWS and Azure services, container orchestrations like Docker and Kubernetes, and more 

Learn More

Application Performance Monitoring Powered by SolarWinds AppOptics

Comprehensive, full-stack visibility, and troubleshooting

View Application Performance Monitoring Info
Complete visibility into application issues

Pinpoint the root cause down to a poor-performing line of code

Learn More

Log Management and Analytics Powered by SolarWinds Loggly

Integrated, cost-effective, hosted, and scalable full-stack, multi-source log management

 View Log Management and Analytics Info
Collect, search, and analyze log data

Quickly jump into the relevant logs to accelerate troubleshooting

Learn More

Surf a site – see its uptime

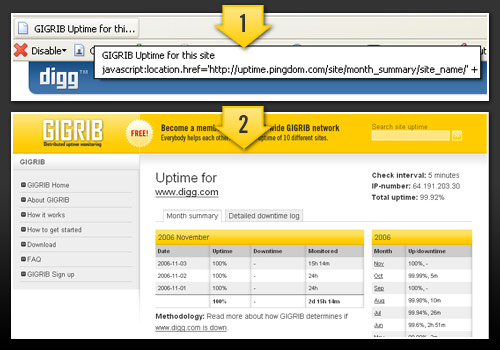
One of the guys here at Pingdom has made a bookmarklet that allows you to see the uptime history for the website you are visiting.

How do you do this? Just make sure your favorites/bookmarks toolbar is visible, then drag and drop Uptime for this site to it. After that you only need to click on the bookmarklet whenever you are visiting an interesting website to be taken to its uptime report page at Pingdom GIGRIB.

061103-gigrib-bookmarklet

A few examples of websites that are already monitored by GIGRIB:

Digg		CNN		BBC
The Pirate Bay 	News.com 	Wikipedia
Apple		Microsoft	Google
MySpace		eBay		Flickr

There are lots more, including a large number of web hosting companies, online banks, and a mish-mash of personal sites, blogs, news sources, etc.

Small note: GIGRIB doesn’t have all the websites in the world, but we have a couple of thousand, and the number is growing steadily. If you find a website you think is interesting and isn’t monitored by GIGRIB, why not become a part of the GIGRIB network yourself and add it? You can add up to 10 sites when you participate, and all the information is publicly and freely available on the Pingdom GIGRIB website.

SolarWinds Observability now offers synthetic transaction monitoring

Powerful transaction monitoring now complements the availability and real user [...]

Exit Rate vs Bounce Rate – Which One You Should Improve and Why

Tracking your website’s exit and bounce rates will give you insight into how [...]

Introduction to Observability

These days, systems and applications evolve at a rapid pace. This makes analyzi [...]

Webpages Are Getting Larger Every Year, and Here’s Why it Matters

Last updated: February 29, 2024 Average size of a webpage matters because it [...]

A Beginner’s Guide to Using CDNs

Last updated: February 28, 2024 Websites have become larger and more complex [...]

Monitor your website’s uptime and performance

With Pingdom's website monitoring you are always the first to know when your site is in trouble, and as a result you are making the Internet faster and more reliable. Nice, huh?

START YOUR FREE 30-DAY TRIAL

MONITOR YOUR WEB APPLICATION PERFORMANCE

Gain availability and performance insights with Pingdom – a comprehensive web application performance and digital experience monitoring tool.

START YOUR FREE 30-DAY TRIAL
Start monitoring for free