


SolarWinds® Pingdom® is an external synthetic monitoring agent designed to monitor your systems from the outside in. If you know what clues to look for, it can provide a great place to triage where a problem is occurring in the system. So how does a Pingdom call work, and how can you use it to debug what’s happening inside the system?
In this article, we’ll look at how Pingdom can help you diagnose latency in your DigitalOcean Kubernetes deployments. We’ll create latency at four levels of our architecture: our edge, our origins, our app, and our database. Then, we will see how we can use Pingdom in a real-world situation to figure out where latency is occurring. By correlating your Pingdom alerts with your infrastructure, you can shave valuable time off your next escalation and better design your tests to conform with your environment.
Our Example
In addition to Pingdom, we’ll also use LinkerD as an intermediary for our Kubernetes cluster to walk through a simple application from the Pingdom call to the application’s response. This serves as an injected monitor into all calls occurring between our services once they enter our front doors. We can use it to watch the bytes traverse our network where our logs may not be so verbose. By using LinkerD agents in between every service of our stack, we can see the different behaviors the Pingdom agents will observe from the outside in.
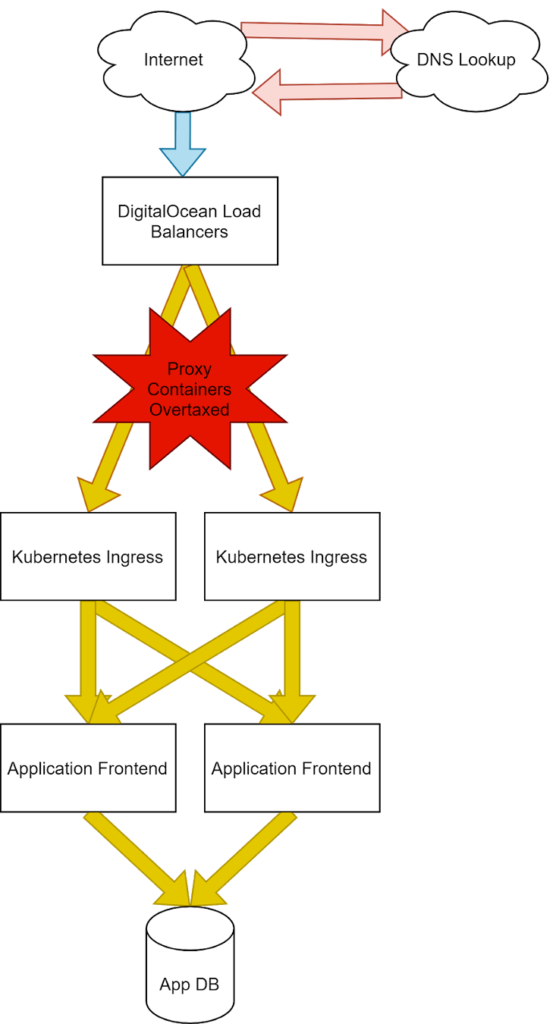
Our Infrastructure
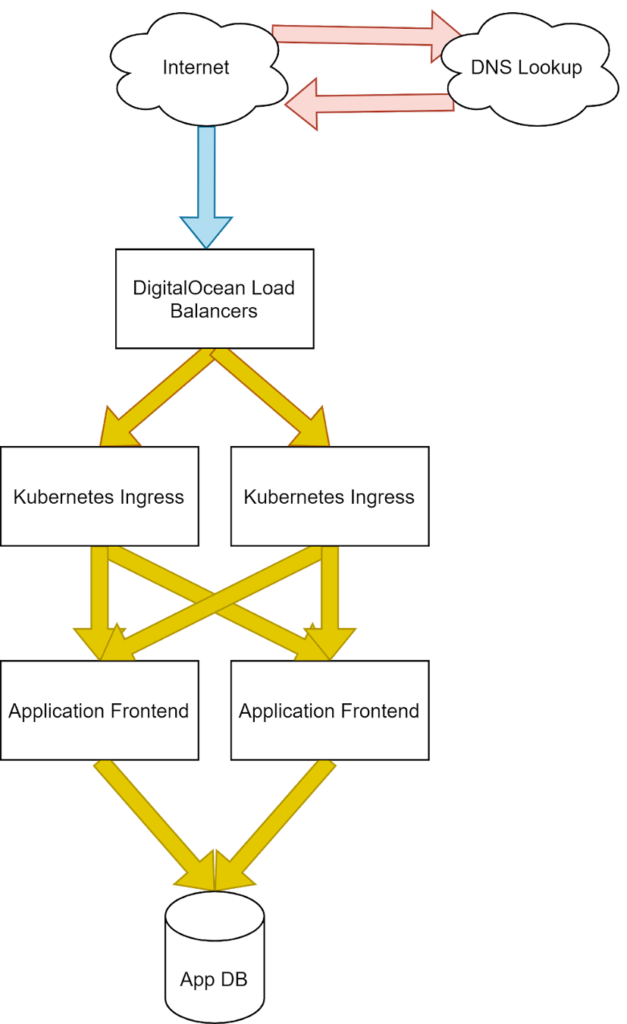
Our application stack mapped with Pingdom site speed metrics.
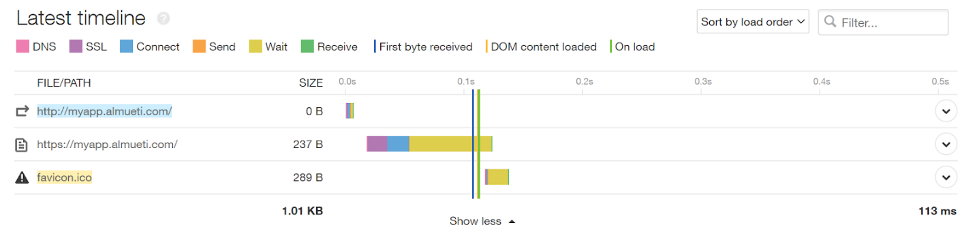
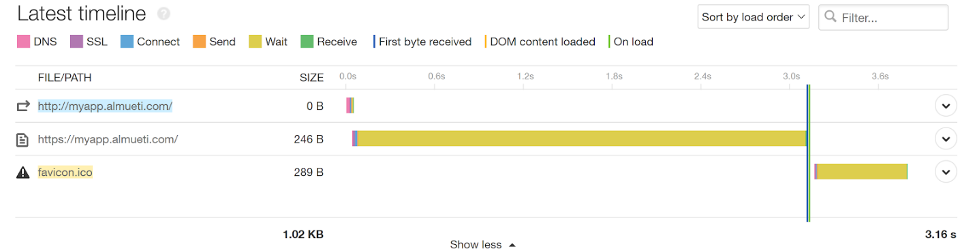
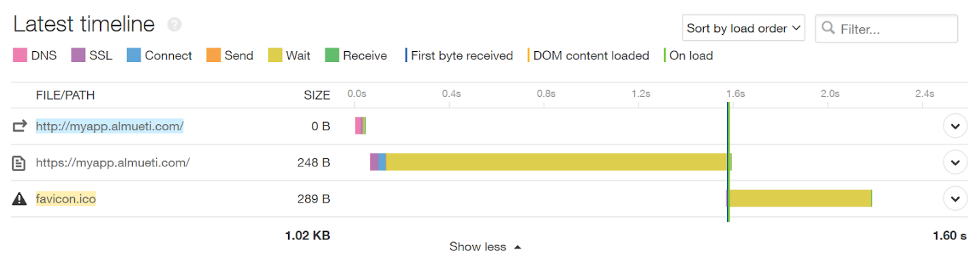
A healthy SiteSpeed timeline
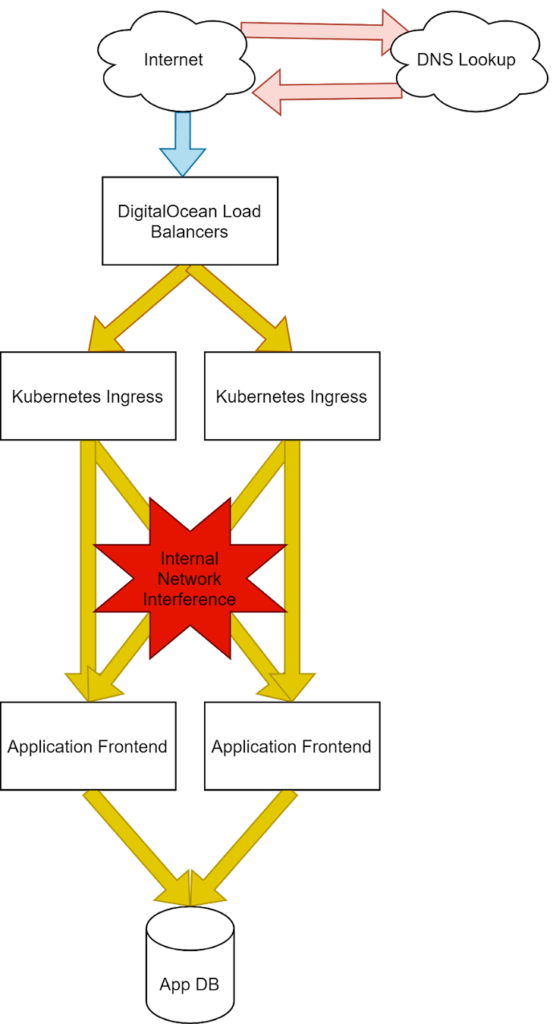
We’ll use a standard infrastructure for the purposes of our demonstration. Here we can see a common pattern of external provider load balancers, our clusters Nginx ingress, Flask application front end, and a database. We’ve color-coded our infrastructure to map to the representative part of the Pingdom Speed Test results, so we can design our tests to show the changes clearly.
It’s important to outline where exactly these connections are occurring because different points of failure will represent differently to an end user and could be critical to identifying where in this stack to begin your investigations.
Translating the Impact
Now let’s inject latency at four different parts of our architecture to see what we can learn from Pingdom.
1. Injecting Latency at Our Edge (Internet Latency)
First, we’ll add latency at our edge level. To do this, we’ll need to inject a server between the internet and our internal systems and slow down the packet queue to observe the results before it hits our network. To this end we’ll use Nginx to pass traffic into the DigitalOcean Load Balancers and the Linux Traffic Control tool to manage our networking latency at various levels of the stack to see how it changes the behavior of our application.
Then, the following will cause any packet to take 200ms longer before making it out of the network queue.
| tc qdisc add dev eth1 root netem delay 200ms
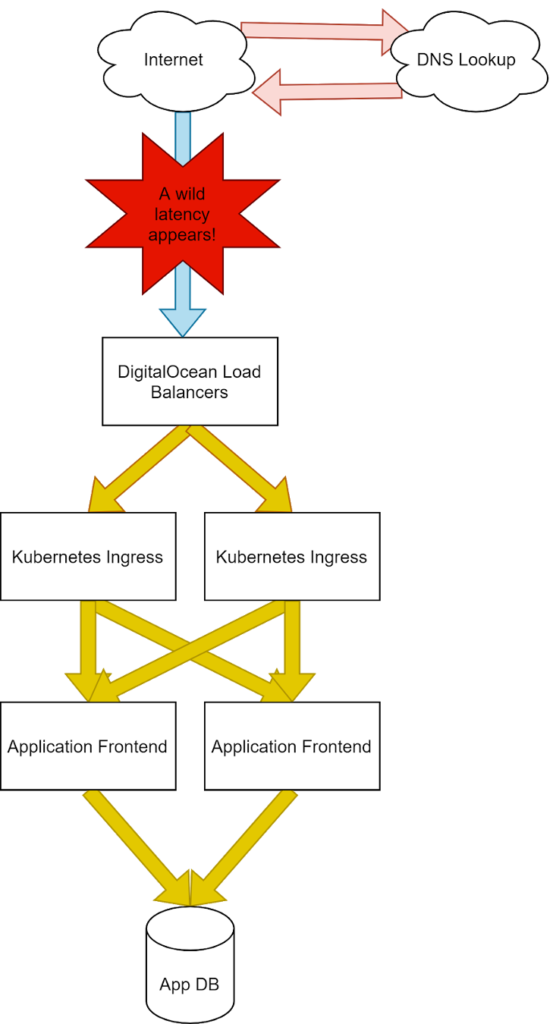
Injecting latency at the ISP.
With the latency injection, we can now see a much longer Connect time for our services. This is due to the time it takes for our packets to reach our system to make the TCP three-way handshake and establish a socket that can pass information between the user’s browser and our servers.
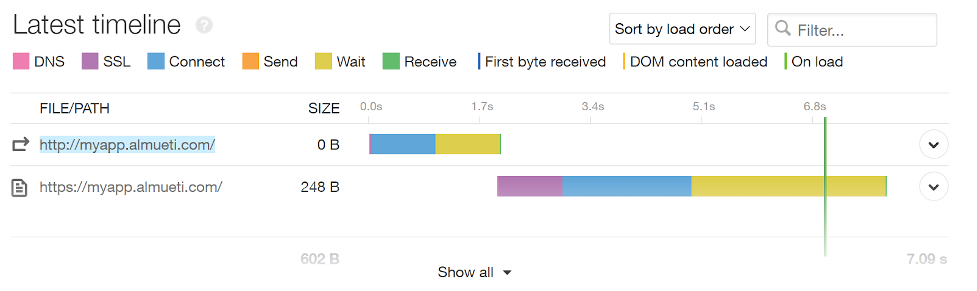
We can see ISP-caused latency is represented by connect time increases.
Even with the high delay shown by our external monitors, our internal monitors show no such latency increase. With these clues, we can safely deduce the problem will exist before the application establishes the socket, and the problem lives outside of our infrastructure.
Our internal metrics show no issues at all.
This is likely an internet problem, and we’ll need to follow up with our internet provider for further debugging. This is a perfect use of our Pingdom toolsets.
2. Injecting Latency at Our Origins (Kube-Proxy Latency)
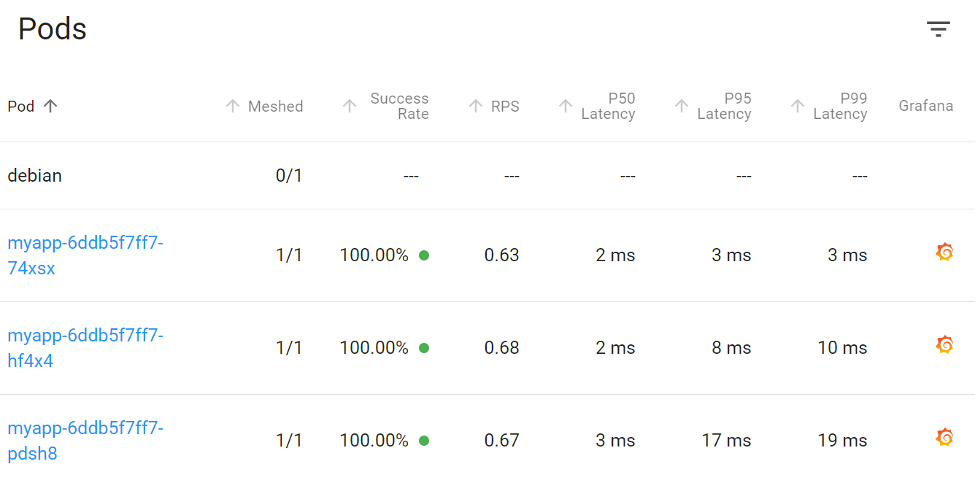
Adding latency at our front door.
In a similar fashion to how we injected latency at our edge, next let’s add latency to our ingress controllers on our actual worker nodes, slowing traffic just as it comes into our purview. This will simulate issues within our infrastructures, such as slow or overburdened servers, or ingress pods with insufficient capacity to manage the load.
We can see in our Pingdom tests that we’re spending a lot of wait time before getting back any information. This indicates a problem within our walls. However, we can see the edge SSL translation happens almost instantly. This is a good indication that the network leading up to our infrastructure is healthy, and our edge traffic is being handled appropriately.
This adds a long wait latency at our application, but not at our edge, indicating internal issues.
In our infrastructure, everything appears to be happy and responsive. If you didn’t have the clues from Pingdom, it’s likely you wouldn’t have identified this problem until your customers notified you on your behalf.
No latency at our applications tells us this is an infrastructure issue.
Our remediation actions for this would likely be to look at our external-facing networking devices and servers responsible for traffic coming into the network. Further investigation into the application itself would not be useful. This is another perfect case where we saved time and our synthetic monitoring caught something our internal systems couldn’t.
3. Injecting Latency at Our Application (App Latency)
Adding latency to our application directly.
On our next step, past our edge, we can see the latency as it’s added to our application interface directly. This would likely be our most common problem since it’s application specific. Pingdom is also showing us a long wait time but with a fast SSL traversal, indicating the problem lives within our walls.
The latency increase here shows long wait times as before, but more data is needed.
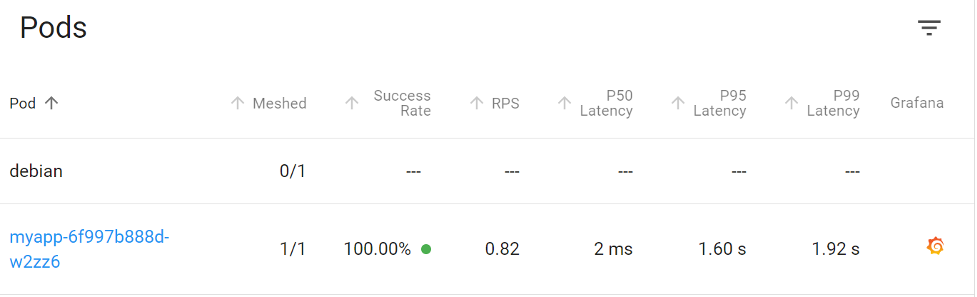
In this case, though, our internal latency metrics also show the high latency averages of >3.5 seconds. It’s certainly the right place to investigate this alert.
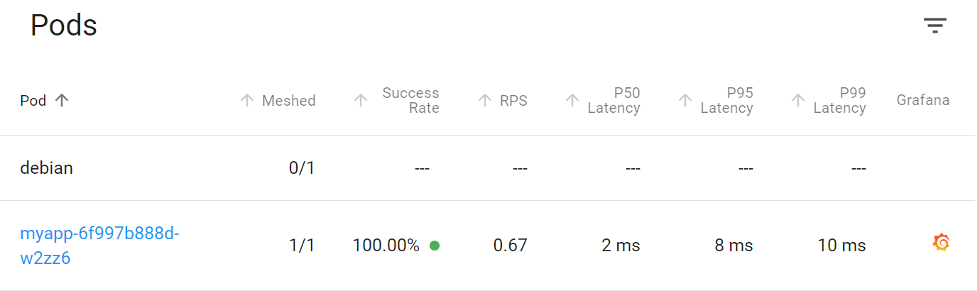
Our service mesh shows us a matching latency to our application, indicating a problem lives within our app.
Here we could consider some mitigation methods, such as restarting applications or determining saturation and capacity of the service.
4. Injecting Latency at Our Database (Back-End Latency)
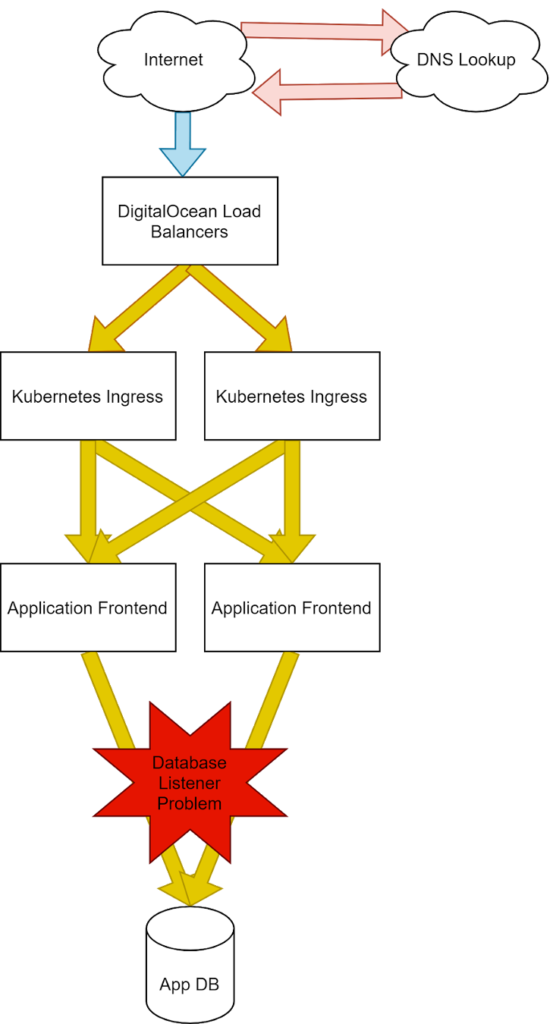
Adding latency to our database.
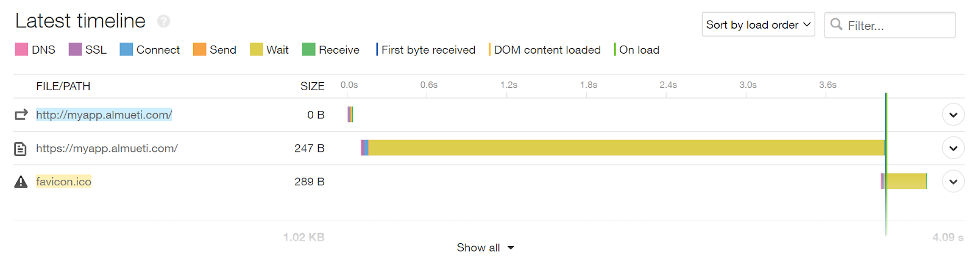
Finally, in our back end, we can see the effects of database side problems. From Pingdom, since the application is responding slowly in the same way, this latency in the “wait time” is unchanged.
Site speed shows shorter latency overall.
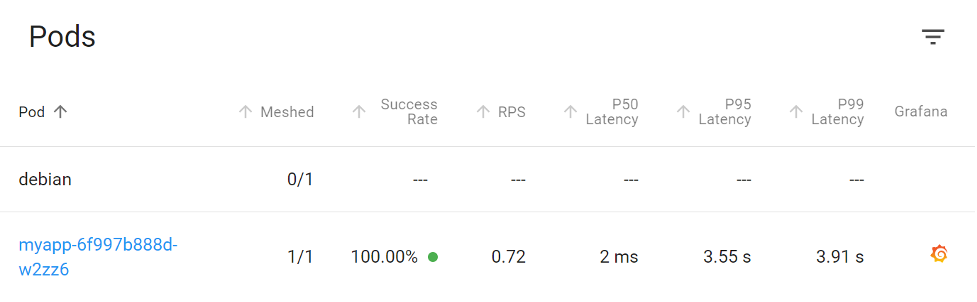
Looking at the pod latency, again we see long calls to the application; however, these are not nearly as severe as the size of the database return. In this case, it only makes up a small size compared to the whole page and requires fewer packets to transmit to the app before shipping the data to the client. This means fewer packets affected by the same amount of latency will reduce overall wait time.
The application also shows a less severe latency overall.
It looks like this is the end of the road for our investigation. With only this data we cannot quite differentiate between an application latency or a database latency. Knowing this, we can now accommodate for alerting and dashboards that adequately show the difference in latency or errors from these systems to speed up our triage time in the future.
Conclusion
Your ecosystem might be complex, and external monitoring may not be able to see into your systems, but you can still gather a lot of context and clues when you fully understand where failures may live. If your tests are set up properly, SolarWinds Pingdom can do more than just “wake you up” and can help you shave off time-to-resolve in your next incident and get you back to bed.


