
In this report we will examine the current status of what is often referred to as the “Browser Wars.” How popular are the various web browsers around the world right now? As you’ll see, there are significant regional differences in web browser usage.
We’ve done this on two levels. First, a quick overview, and below that we’ve gone into more detail about the current web browser usage in each world region, as well as the overall usage in the world. Plenty of charts, we promise!
The data is very recent, reflecting web usage the first 3 weeks of April (courtesy of StatCounter, based on visits to 3+ million websites). So this is very much the status right now.
Overview
The days when IE completely dominated the browser landscape are long gone. Microsoft’s browser still has a big chunk of the market, but much less so in some regions than others. It has lost its lead in Europe, Asia, Africa and South America, but remains dominant in North America and Oceania (consisting primarily of Australia).
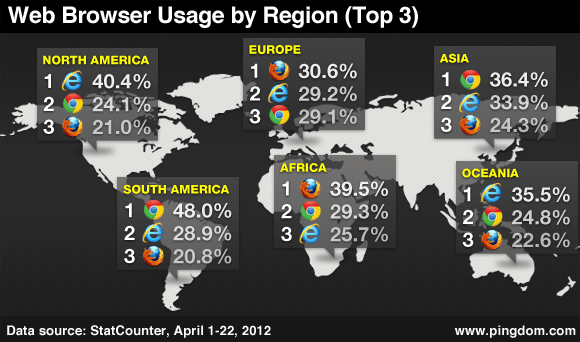
As you can see by this map, the “big three” are no doubt IE, Firefox and Chrome. Opera and Safari are both out of the top three in all world regions.
An interesting observation is that IE, Chrome and Firefox each top two regions.
One could also argue that open source has won the browser wars. Firefox and Chrome together make up a majority part in every region.
Now, let’s dig into this data in more detail…
Web browser usage in North America
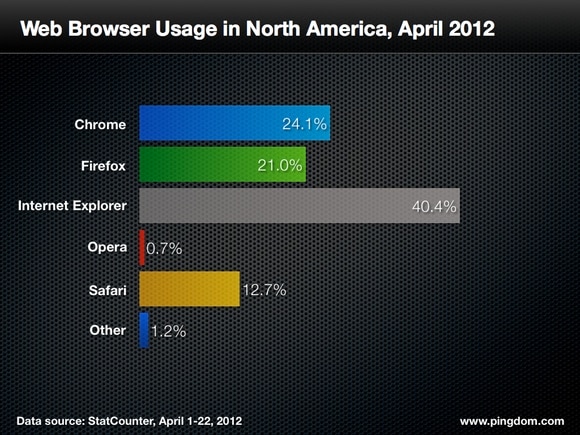
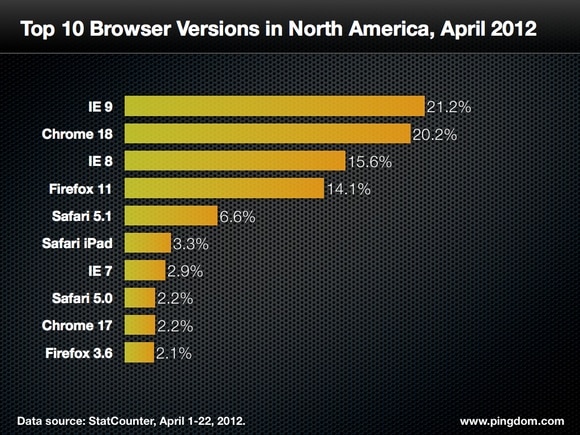
North America is the only region where IE usage really dominates by a wide margin. It’s still well below the 50-percent line, though. This is also one of the strongest markets for Apple’s Safari, the other being Oceania.
Web browser usage in South America
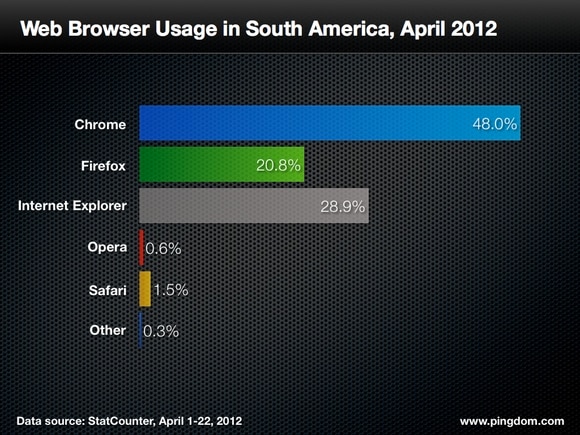
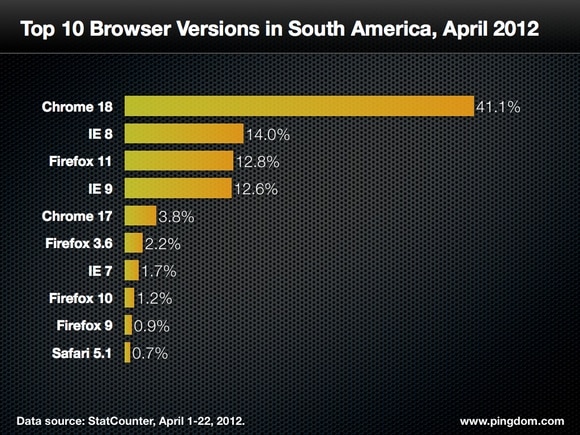
South America loves Google. Not only is Brazil the main stronghold for Google’s first social network, Orkut, but overall browser usage in the region strongly favors Google’s browser. Chrome became the most common browser in South America back in October last year. The most recent version of Chrome is now used 3x as much as the second-most-used browser version, IE 8.
Web browser usage in Europe
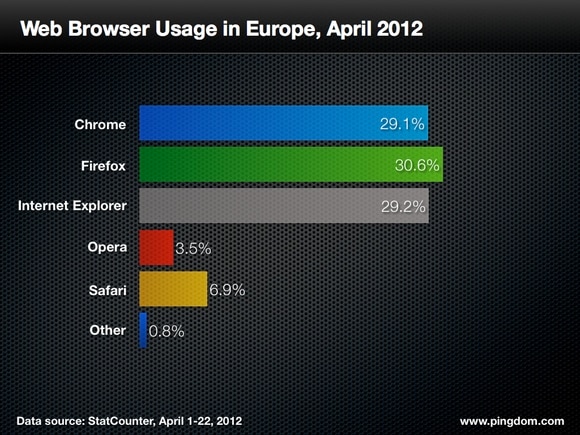
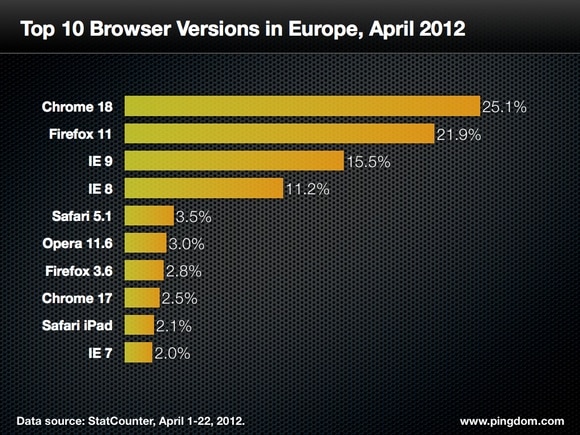
Europe is the most even browser battlefield, with usage being almost equal between IE, Chrome and Firefox. Chrome and IE usage is neck and neck, and Firefox only leads by a thin margin.
Web browser usage in Africa
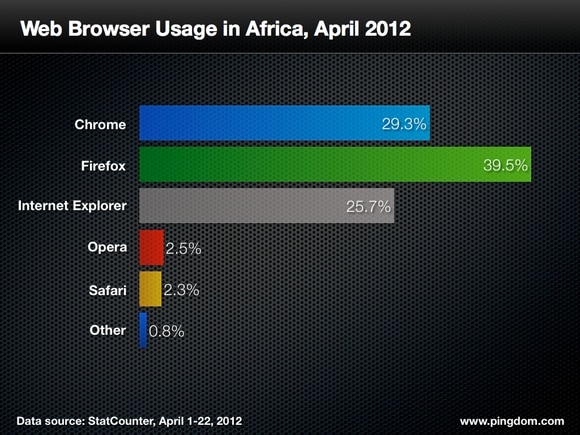
This is clearly a continent that has embraced Mozilla’s web browser more than any other part of the world. That said, if you look at individual browser versions, Chrome’s latest is in the lead (as it is everywhere but North America).

Web browser usage in Asia
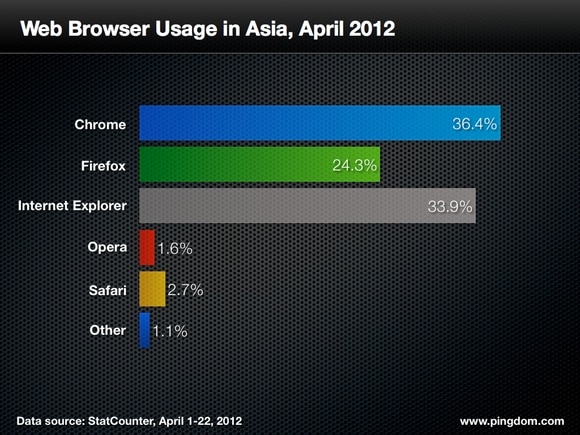
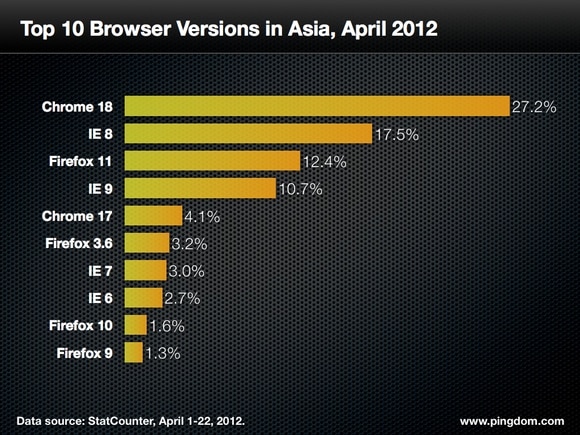
IE only lost the crown in Asia very recently, as we reported a few weeks ago. Now Chrome is in the lead, and everything points to this lead increasing.
Web browser usage in Oceania / Australia
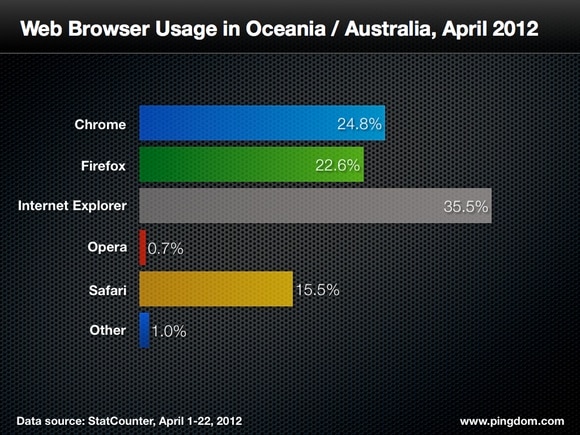
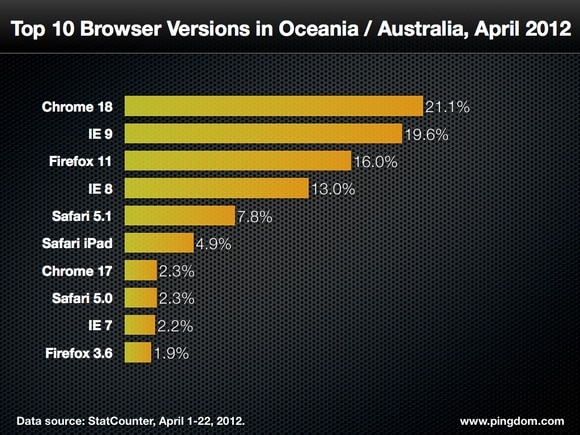
Oceania is the second world region where IE still is in the lead, but it’s not as dominant here as it is in North America. This is Safari’s strongest market, partly thanks to the iPad (see “A few additional observations” for more on that).
Web browser usage worldwide
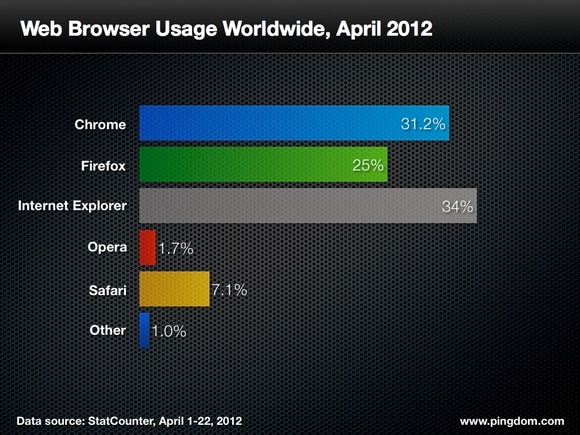
If you’ve read this far, we suspect you’re also curious about the overall worldwide status. So here it is.

A few additional observations
- Google has been very successful with keeping Chrome users up to date (thanks to automated, silent updates). This is a contributing factor to the latest official version of Chrome being the most widely used browser version in the world. This is great because it minimizes fragmentation, at least of the Chrome browser. Microsoft’s IE suffers from the exact opposite approach, showing a lot of fragmentation between its versions.
- Also of note is that Safari for iPad has managed to cram itself into several of the top 10 lists of individual browser versions. (StatCounter doesn’t separate out tablet browsers from its statistics, although it does separate out mobile browsers and small-screen devices.) Apple’s tablet is not only selling in large quantities, people are most definitely using it. Based on this, the markets where the iPad has had the most impact would be Oceania, North America and Europe, in that order. Australians sure seem to love their iPads.
- You may tear up reading this, but IE 6 is still around. On the plus side, it’s only in two of the top 10 lists, the one for Africa, where it came in last place, and the one for Asia, where it came in 7th place. (Correction: We originally overlooked Asia here, as a commenter pointed out.)
Conclusion
The glory days of IE may be over, and its market share may be diminishing by the day, but it’s still not something web designers can ignore. At least IE 6 is getting pretty rare these days.
How the lay of the land will look like a year from now is anyone’s guess, but judging by the current trends IE will continue to lose market share, and Chrome will gain significantly. Chrome is actually well on its way to becoming the most widely used web browser in the world. The projection for Firefox is less clear, but historically some of Chrome’s gains have come at its expense, so the outlook isn’t great for Mozilla’s browser unless they do something drastic to turn the trend.
We hope you enjoyed this “status update” of browser usage across the world. How is your favorite browser doing?


