


At SolarWinds, we’re constantly thinking ahead to develop observability solutions that evolve with you and that abstract application and IT complexity so that you can deliver an exceptional digital experience for your business.
And today, we’re excited to announce – SolarWinds Observability SaaS is here!

SolarWinds Observability SaaS includes application, infrastructure, database, network, log, and digital experience observability in a modern, multi-tenant SaaS platform. This extensive functionality makes it possible to deliver business insights, operational intelligence, and automation at a business service level.
SolarWinds Observability SaaS offers a fully integrated solution for observing cloud-native and legacy applications deployed on public cloud, on-prem or hybrid infrastructure. It enables DevOps teams and developers to gain insights into performance and troubleshoot with code-level diagnostics for a broad range of programming languages and frameworks. SolarWinds Observability SaaS provides:
- Comprehensive visibility for custom, distributed, microservices-based applications
- AI / ML-driven intelligent automation
- Complete monitoring, including websites, services, hosts, logs, AWS, Azure, databases, and private networking devices
- Logical groupings for holistic health monitoring of critical business services, prioritizing the issues you care about most
SolarWinds Observability SaaS is quick to implement and easy to use, providing full-stack observability to eliminate tool sprawl, increasing productivity, and providing exceptional time to value.
What makes SolarWinds Observability SaaS unique is its ability to serve as a unified, single source of truth, enabling you to:
- Deploy new cloud-native apps quickly with quality and stability
- Diminish downtime and improve the digital experience
- Speed existing app modernization projects
Open and extensible, SolarWinds Observability SaaS leverages open-source frameworks (OpenTelemetry) and third-party integrations. And for those that have both on-premises and cloud-native applications or are transitioning to the cloud, it seamlessly integrates with SolarWinds® Observability Self-Hosted to provide an unparalleled, unified fabric across cloud-native, multi-cloud, hybrid, and on-premises environments.
Unified capabilities of SolarWinds Observability SaaS include:
Application:
Comprehensive and detailed code-level monitoring to assess, debug, and troubleshoot application performance with time series metrics and distributed tracing. Ensures the availability and performance of applications and services, specializing in cloud-native, custom, distributed microservices-based applications
- Delivers data-rich intelligence on the state of critical business services deployed across multiple cloud-native technologies and providers
- Reduces MTTR to help increase the productivity of high-velocity DevOps teams
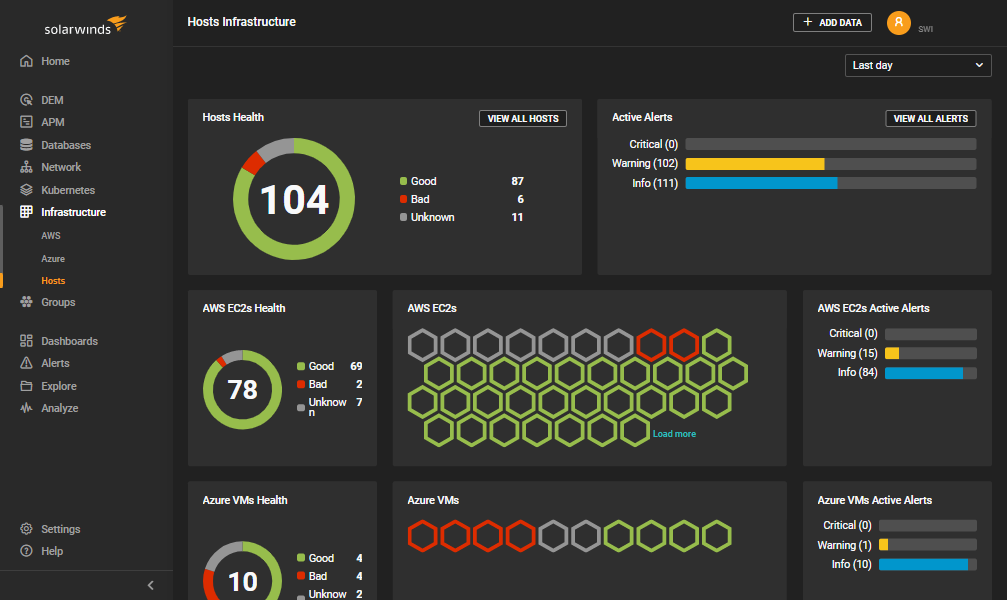
Infrastructure:
Ensures the health and performance of cloud-based and on-premises resources, including virtual and physical hosts and Kubernetes® orchestrated containers across multiple cloud service providers.
- Offers data-driven insights allowing AIOps to proactively monitor health and performance across cloud resources
- Scales seamlessly with broad support for cloud-native and open frameworks and comprehensive support for third-party integrations to better simplify operations
Log:
Scalable, full-stack, multi-source log management combining broad support, powerful search, log filtering, and built-in integration with application and infrastructure observability (licensed independently), delivering context-rich intelligence enabling teams to troubleshoot smarter and faster, increasing productivity.
- Provides context to event data with analysis of log data across the entire set of cloud applications, services, and infrastructure stack, reduces complexity
- Simplifies troubleshooting with real-time log tailing and intuitive search across all logs to accelerate root cause
- Leverages cloud-native frameworks for easy setup with comprehensive support for cloud-native and open-source
Digital experience:
An integral part of the unified SolarWinds Observability SaaS solution, it provides the client-side or end-user perspective of the availability and performance of web applications.
- Includes proactive performance management via automated performance monitoring and alerting for when web applications are running slowly, potentially causing a poor user experience, and catching it before it impacts customers
- Enables global insights into user experience by utilizing probes that can be implemented worldwide to provide insights into users’ perspectives on availability and performance
Database:
Provides performance insights to diagnose and analyze issues using sophisticated root cause analysis. It has multi-vendor support for databases such as MySQL®, PostgreSQL®, Microsoft® SQL Server®, AWS Aurora® (PostgreSQL, MySQL), AWS RDS® (PostgreSQL, MySQL), MongoDB®, MongoDB Atlas, and Redis®.
- Encourages better code shipment by showing query responses before and after a deployment event.
- Speeds up outage troubleshooting and diagnosing with correlated query response or behavior to system metrics and isolate unusual behavior and potential contributing factors within the database to understand impacts
- Creates a complete view of database health with the ability to track metrics, explore and examine performance outliers, and watch for trends with health summaries and recommendations based on best practices for databases
Network:
Helps create end-to-end visibility across multi-vendor, on-premises, and multi-cloud networks, combined with AIOps with enhanced machine learning-powered analysis of network metrics for insights into the impact of network performance on services and users.
Gain complete visibility into network status and utilization with network device detail views by IP address, machine type, vendor response time, CPU utilization, memory utilization, availability, packet loss
- Insights into network performance and capacity with interface speed, in and out percent utilization average, average availability, active alerts, drill down into history—availability, percentage utilization, byte totals, discards, errors
- Analyze and optimize network traffic with network flows by showing the top 10 endpoints by ingress and egress bytes
For more information on SolarWinds Observability SaaS – Learn More.


