Synthetic Monitoring

Simulate visitor interaction with your site to monitor the end user experience.

View Product Info

FEATURES

Simulate visitor interaction

Identify bottlenecks and speed up your website.

Learn More

Real User Monitoring

Enhance your site performance with data from actual site visitors

View Product Info

FEATURES

Real user insights in real time

Know how your site or web app is performing with real user insights

Learn More

Infrastructure Monitoring Powered by SolarWinds AppOptics

Instant visibility into servers, virtual hosts, and containerized environments

View Infrastructure Monitoring Info
Comprehensive set of turnkey infrastructure integrations

Including dozens of AWS and Azure services, container orchestrations like Docker and Kubernetes, and more 

Learn More

Application Performance Monitoring Powered by SolarWinds AppOptics

Comprehensive, full-stack visibility, and troubleshooting

View Application Performance Monitoring Info
Complete visibility into application issues

Pinpoint the root cause down to a poor-performing line of code

Learn More

Log Management and Analytics Powered by SolarWinds Loggly

Integrated, cost-effective, hosted, and scalable full-stack, multi-source log management

 View Log Management and Analytics Info
Collect, search, and analyze log data

Quickly jump into the relevant logs to accelerate troubleshooting

Learn More

New public status pages out of beta

Not betaAs of today, the new public reports (a.k.a. public status pages) are no longer in beta. We here at Pingdom would like to thank you all for your feedback during the beta testing period.

The old-style public reports will continue to work until May 31. After that date, they will automatically redirect to the new reports.

If you’re not already using the new style of public report (it uses a different URL than the old one), now might be a good time to switch. All the information you need is available under Public Reports in the Pingdom control panel.

The new public reports give you a ton of more features. Among other things you get charts, you can customize the design, and even connect the report to a custom domain (even Pingdom users with free accounts can do this).

For those of you who missed it, this is what the new public status overview looks like (if you activate it), and from there you can access more detailed reports about each check.
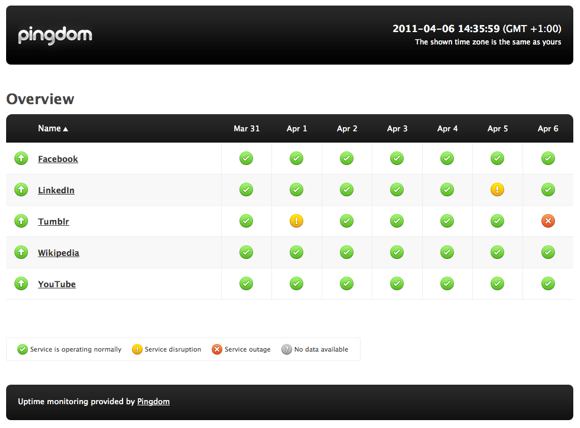
Public status page

What you see here above is the default Pingdom style. As we have mentioned, you can add your own logo and colors to make the style of the status page match your own.

Now just remember that all old public reports will switch over to the new ones automatically on May 31st.

Exploring the Software Behind Facebook, the World’s Largest Social Media Site

At the scale that Facebook operates, several traditional approaches to serving w [...]

The Developer Obsession With Code Names – 200+ Interesting Examples

Code names can be about secrecy, but when it comes to software development, it†[...]

Web API Monitoring Explained: A Helpful Introductory Guide

An API, application programming interface, is a collection of tools, protocols, [...]

User Experience for Observability

Modern software applications involve multiple layers of code and services, work [...]

Announcing SolarWinds Observability

At SolarWinds, we’re constantly thinking ahead to develop observability solut [...]

Monitor your website’s uptime and performance

With Pingdom's website monitoring you are always the first to know when your site is in trouble, and as a result you are making the Internet faster and more reliable. Nice, huh?

START YOUR FREE 30-DAY TRIAL

MONITOR YOUR WEB APPLICATION PERFORMANCE

Gain availability and performance insights with Pingdom – a comprehensive web application performance and digital experience monitoring tool.

START YOUR FREE 30-DAY TRIAL
Start monitoring for free