Synthetic Monitoring

Simulate visitor interaction with your site to monitor the end user experience.

View Product Info

FEATURES

Simulate visitor interaction

Identify bottlenecks and speed up your website.

Learn More

Real User Monitoring

Enhance your site performance with data from actual site visitors

View Product Info

FEATURES

Real user insights in real time

Know how your site or web app is performing with real user insights

Learn More

Infrastructure Monitoring Powered by SolarWinds AppOptics

Instant visibility into servers, virtual hosts, and containerized environments

View Infrastructure Monitoring Info
Comprehensive set of turnkey infrastructure integrations

Including dozens of AWS and Azure services, container orchestrations like Docker and Kubernetes, and more 

Learn More

Application Performance Monitoring Powered by SolarWinds AppOptics

Comprehensive, full-stack visibility, and troubleshooting

View Application Performance Monitoring Info
Complete visibility into application issues

Pinpoint the root cause down to a poor-performing line of code

Learn More

Log Management and Analytics Powered by SolarWinds Loggly

Integrated, cost-effective, hosted, and scalable full-stack, multi-source log management

 View Log Management and Analytics Info
Collect, search, and analyze log data

Quickly jump into the relevant logs to accelerate troubleshooting

Learn More

Human errors most common reason for data center outages

We recently blogged about some statistics we have collected on different reasons why a website can be down. Our statistics mostly covered software and network issues with facts about the most common problems.

With this in mind we found it interesting when we encountered a survey by Aperture Research Institute done back in April 2007 that asked the question “Which causes of outage have you experienced?”

According to the survey, human errors are behind 57.3% of all data center outages. The second most common reason was improper failover with 43.7%.

Reasons for data center outages
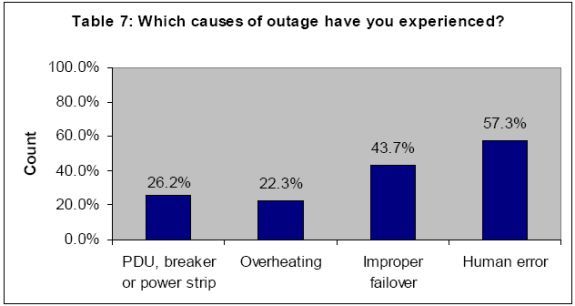
Above: Diagram from the Aperture survey.

Another interesting fact from the survey is that 21% of the participants did not know how many servers their racks could handle power wise. This is a statement from the conclusion of the survey:

In many cases the widespread use of high-density equipment is putting a strain on data center infrastructure, massively reducing any margin for error…

Unfortunately the survey does not go into more detail about the type of errors involved, and of course human errors can be hard to categorize.

What you can do to minimize the risk of human errors

To minimize the risk of the “human factor” affecting operations, it is important to have up-to-date documentation on everything connected to your data center and manuals on how different critical operations should be performed.

Manuals and documentation together with scheduled tests should help you avoid many of the problems and outages described in this survey.

About the survey

More than 100 data center professionals from a broad selection of industries participated in the survey, which also covered the topics of data center power usage and the use of blade servers.

Introduction to Observability

These days, systems and applications evolve at a rapid pace. This makes analyzi [...]

Webpages Are Getting Larger Every Year, and Here’s Why it Matters

Last updated: February 29, 2024 Average size of a webpage matters because it [...]

A Beginner’s Guide to Using CDNs

Last updated: February 28, 2024 Websites have become larger and more complex [...]

The Five Most Common HTTP Errors According to Google

Last updated: February 28, 2024 Sometimes when you try to visit a web page, [...]

Page Load Time vs. Response Time – What Is the Difference?

Last updated: February 28, 2024 Page load time and response time are key met [...]

Monitor your website’s uptime and performance

With Pingdom's website monitoring you are always the first to know when your site is in trouble, and as a result you are making the Internet faster and more reliable. Nice, huh?

START YOUR FREE 30-DAY TRIAL

MONITOR YOUR WEB APPLICATION PERFORMANCE

Gain availability and performance insights with Pingdom – a comprehensive web application performance and digital experience monitoring tool.

START YOUR FREE 30-DAY TRIAL
Start monitoring for free