Today, just about all computers have hard drives. In fact, in the last quarter of 2011, global hard drive shipments reached approximately 125 million units. But what was the situation like back in the 1970s? Personal computers were (almost) unheard of, and computers were typically large as rooms and run by guys in white lab coats.
Aren’t you curious to find out just how big the global market for hard drives was back then? Let’s find out.
5 MB used to be a lot
We’ve covered the history of hard drives before here on the Royal Pingdom blog, and brought to you some spectacular images of how the technology has developed.
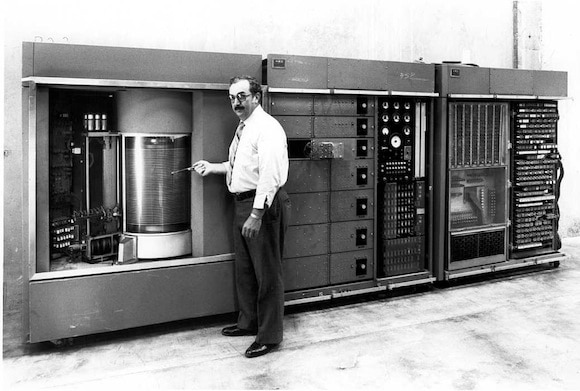
To give you a sense of what the early hard drives looked like we present you with the IBM RAMAC. The RAMAC 305 (Random Access Memory Accounting System) by IBM had a component called the IBM 350 Disk Storage, which was an ancestor to the hard drive as we know it today. It was a huge stack of metal platters that could store up to 5,000,000 characters (that’s roughly 5 MB!), which was equal to 64,000 punch cards.

Picture from the RAMAC Restoration Web Site.
If you’re interested, check out the manual of operations for the IBM 305 from 1957.
The hard drive market in the 1970s
Let’s dig into the numbers for the global hard drive market in the 1970s. We’ve looked at “Walther’s Disk Data Book” from August 1976, published by the Lee Walther and Company, Cupertino, California. It details both market share for the leading suppliers of “non-removable media disk drives” as well as the quantity of shipped drives worldwide. First, we look at drives with a storage capacity less than 200 MB.
| 1975 | 1976 | |||
| Manufacturer | Quantity | % | Quantity | % |
| Caelus (EM&M) | 1,000 | 11.1 | 1,000 | 6.7 |
| CDC | 0 | 0 | 200 | 1.3 |
| Diablo | 1,000 | 11.1 | 1,000 | 6.7 |
| IBM | 6,000 | 66.7 | 10,000 | 66.7 |
| Microdata | 0 | 0 | 200 | 1.3 |
| Pertec | 500 | 5.5 | 1,600 | 10.7 |
| Wangco (Perkin-Elmer) | 500 | 5.5 | 1,000 | 6.7 |
As you can see IBM was in the clear lead with almost 67% of the market. But what did that mean in absolute number of units?
| 1974 | 1975 | 1976 | 1977 | 1978 | 1979 | 1980 | 1981 | |
| Installed | 700 | 9,700 | 24,500 | 60,000 | 110,000 | 170,000 | 245,000 | 330,000 |
| Shipped | 530 | 9,000 | 15,000 | 36,000 | 50,000 | 65,000 | 78,000 | 90,000 |
In this table, “installed” means how many units were installed as of the end of the respective year. “Shipped” means cumulative shipments during the respective year.
IBM dominated the market for smaller capacity drives, but for drives larger than 200 MB, Control Data Corp. had the lead with almost 56% of the market in 1975.
| 1975 | 1976 | |||
| Manufacturer | Quantity | % | Quantity | % |
| Ampex | 200 | 4,0 | ||
| Calcomp | 300 | 6.0 | ||
| Control Data Corp. | 70 | 56.0 | 930 | 18.6 |
| Honeywell | 25 | 20.0 | 20 | 0.4 |
| IBM | 3,000 | 60.0 | ||
| Storage Technology | 10 | 8.0 | 500 | 10.0 |
| Univac/ISS | 20 | 16.0 | 50 | 1.0 |
However, the global market for these larger drives was pretty tiny in the middle of the 70s, as you can see below.
| 1974 | 1975 | 1976 | 1977 | 1978 | 1979 | 1980 | 1981 | |
| Installed | 10 | 135 | 5,135 | 15,135 | 28,500 | 43,000 | 58,000 | 75,000 |
| Shipped | 10 | 125 | 5,000 | 10,000 | 13,500 | 15,000 | 16,000 | 18,000 |
If you add up the numbers, in 1974, the global market for hard drives was 710 units installed and 540 units shipped.
How much did a hard drive cost in those days? The IBM RAMAC system we mentioned above could be rented for $3,200 per month. That’s about $26,000 today, adjusted for inflation. That was of course the whole system, not just the storage component, but it gives us an indication of what a drive would have cost.
SSD next
Today, the development to watch is perhaps not so much to just look at the hard drive market but to look at it in relation to the solid state drive (SSD) market. SSD prices have come down dramatically in recent years but the hard drives still keep the edge in terms of price per gigabyte.
Image (top) via Shutterstock.


