


Originally published on Loggly.com.
The architecture of modern web applications presents new challenges for monitoring their availability and performance. Modern apps have higher traffic and reliability requirements than ten years ago. Monitoring solutions need to handle higher volume while presenting information in real time and proactively alerting teams about trouble before downtime occurs. In distributed environments, this is made even more difficult by network boundaries that can hide the source of errors and performance problems. In this article, we will take a whirlwind tour of best practices for monitoring your services. We’ll cover availability from the outer edges to the core metrics that can provide early warning signs before your next outage.
Key Metrics: RED
There are countless metrics that you can choose to monitor, and it can be overwhelming to separate the signal from the noise coming in. To avoid monitoring and alerting fatigue, choose a few “primary” metrics. We recommend using metrics important to user experience and application health. The RED metrics method provides a general framework for monitoring the health of a request-based service via three metrics:
- Rate – number of requests per second your application is serving
- Errors – percentage of requests that result in an error status code
- Duration – amount of time each request takes, typically represented as a percentile distribution
Keep in mind that RED monitoring doesn’t necessarily tell the state of the whole system or provide answers as to why something is failing. This can be done by collecting additional metrics on all of the related systems (such as databases, container runtimes, queues, or external APIs) or collecting custom metrics. Use RED metrics as an entry point to your system, but don’t solely rely on them to understand the state of your applications.
Availability Monitoring
At the outer edge of monitoring are black box availability and user-centric uptime monitoring tools. These tools will test the uptime and response times for your site by pinging pre-defined routes periodically and reporting back on them.

Here we are monitoring a site using Pingdom®, a tool for monitoring end-user uptime. This view gives us a dashboard of the uptime checks for the site, whether the checks succeeded, and how long they’ve taken, plus statistics about service uptime. We can see that our site had unreliable performance with many spikes in response time throughout the day. This isn’t a single event, but an ongoing problem that will require attention from the ops team. Used with other metrics, these uptime checks can identify downtime as well as encourage practices like zero downtime deployments.
Using these tools, you can get a quick idea of how your site is responding from different locations in the world, and better understand uptime and performance statistics about it. However, uptime monitoring should be used as a last line of defense and for understanding the end-user experience. By the time an uptime checker knows that your site is slow or down, your users do too, and problems can often be discovered and alerted on before issues ever reach your customers.
Application Performance Monitoring
Moving deeper into the stack, Application Performance Monitoring (APM) is designed to provide deep insights into the state and performance of your applications. This type of monitoring is typically installed as a library in your codebase, providing the opportunity for deep integration. Depending on the language and client’s features, APM can provide request and response information, database connection information, remote profiling and tracing for slow spots, and other metrics related to the health of your services.
AppOptics™ provides APM and tracing capabilities, as well as infrastructure monitoring to give a full view from CPU to custom metrics. With the AppOptics frameworks, getting useful RED metrics is as simple as installing the agent client library for your favorite language.
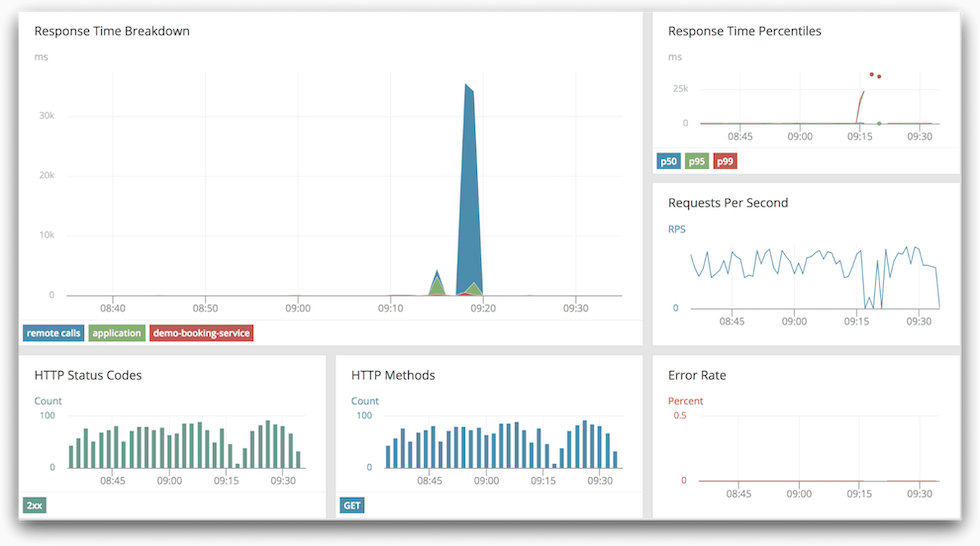
In this example, we installed the AppOptics Node APM agent and integrated it with our application. Thanks to the standardization of common server libraries, the AppOptics agent was able to automatically provide RED metrics and a dashboard for our application. Out of the box, we get duration (Response Time Breakdown), rate (Requests per Second in the dashboard), and errors (error rate and HTTP status codes chart). In the duration graph, we can see a spike in response time starting around 9:15, but the system quickly recovered.
This dashboard has another important chart. Response time as an absolute unit can be deceptive, as it is relative to each application and the time period that the graph is showing. The dashboard in the upper right displays response time percentiles. This gives us a moving distribution of response times and enables us to rapidly identify anomalies based on relative changes from the normal performance of our application.
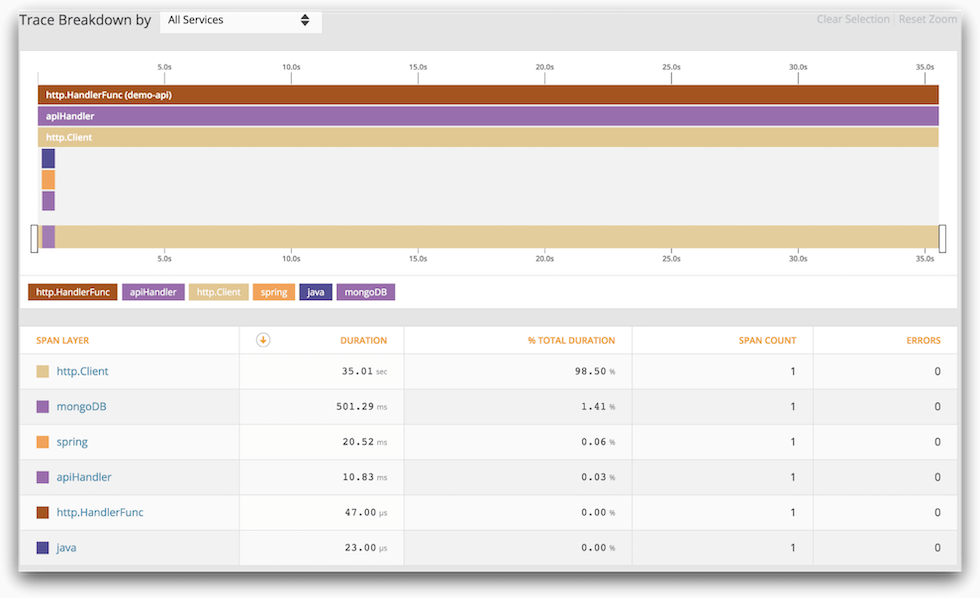
For distributed systems, one of the best practices you can begin integrating into your applications is distributed tracing. With AppOptics, it’s as easy as adding traces and spans using the client libraries and integrating them into your API clients. Tracing gives deep insights into your system and shows the flow of function calls and network traffic through your entire system.
Log Monitoring
While metrics provide us aggregatable health information of our services over time, they are less useful in identifying why something is going wrong or getting deeper information into anomalies into our systems. Logs are generated all the time, but they provide more information than metrics.
The first key to good logging is to make our logs useful. To do that, only log actionable events that machines or humans can use, and don’t generate logs on normal informational events. Request logging, unless there’s an error or required for compliance reasons, can be easily replaced by using a metric and moving on.
Loggly® is the tool for collecting these logs in a distributed environment and turning it into a searchable event stream that can be monitored and alerted on. Loggly provides automatic detection of common log formats, can parse formats such as JSON, and index the keys for use in alerting. Data can also be extracted from more esoteric log formats with the use of regular expressions or string matching. However, when possible, use some sort of machine parse-able or standardized format. Logs are not useful if they can’t be tracked, and in modern web applications, volume can be too high to parse by hand.
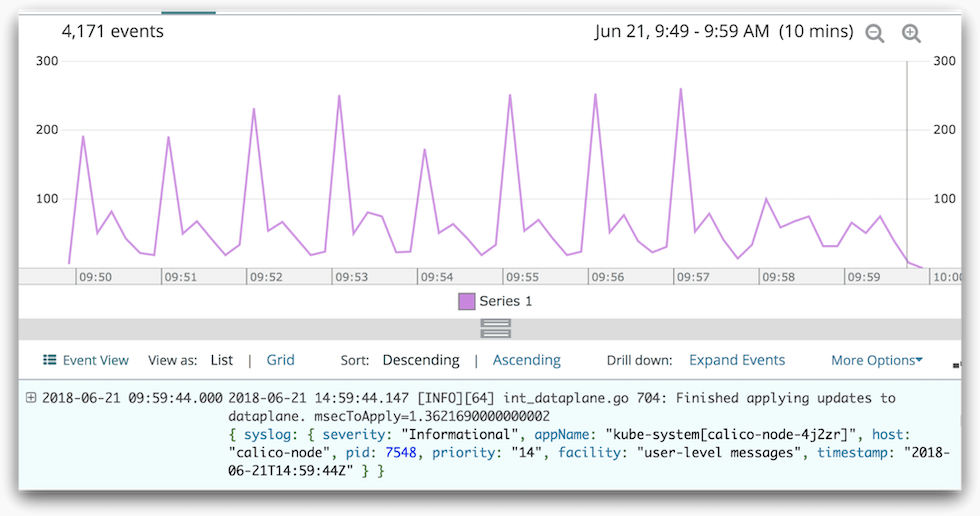
Loggly provides both aggregated and individual data for logs, allowing you to find the exact information you need at any time. Below we see a message from the Calico node that updates were finished being applied.
Logging and alerting can also be used for reliable error monitoring and tracking.
Error Monitoring
Using separate error reporting services can fracture your monitoring between logging and error reporting. Using Loggly for error reporting and alerting gives a single pane of glass for normal application logs and exceptional events. This can be as simple as creating filters and charts looking for logs that are errors, and creating alerts on them.
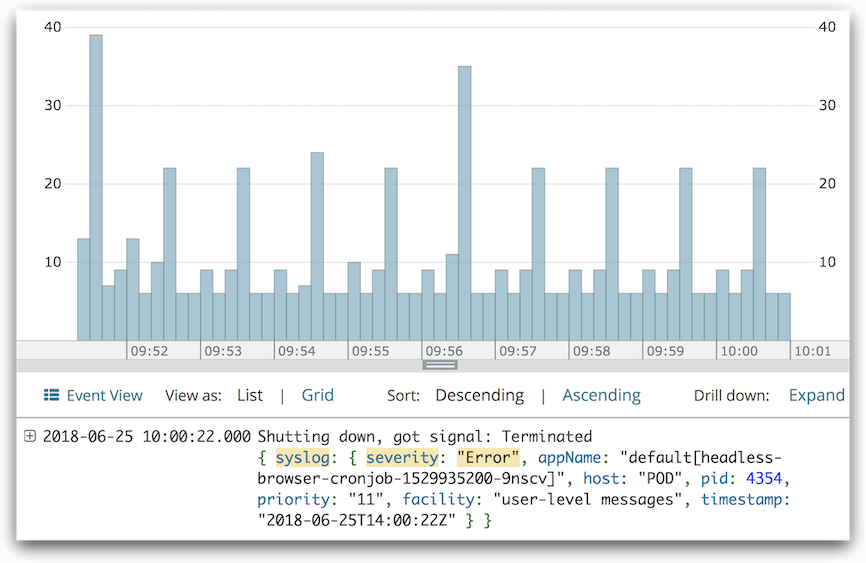
Syslog is a standard system protocol for logging, and can differentiate logs by severity level ranging from debug messages to emergency logs. This view shows a series of application level error logs that we can filter and alert on. Combined with JSON logs, derived fields, or other standard formats, handling error management from your logging system is incredibly flexible. You can customize how your data is parsed, and how to visualize and receive alerts on your errors.
Next Steps
Now that you’ve seen some of the best practices for web app monitoring, it’s time to integrate them into your own applications. Get started with Loggly, AppOptics, and Pingdom today and take control of your entire web application stack. They are designed to give you visibility into the metrics most important to application health and user experience, such as the RED metrics. With these tools, you’ll be able to troubleshoot and solve problems faster.
The Loggly and SolarWinds trademarks, service marks, and logos are the exclusive property of SolarWinds Worldwide, LLC or its affiliates. All other trademarks are the property of their respective owners.


