 In October, Windows 7 usage has for the first time surpassed Windows XP usage globally according to statistics from StatCounter. In other words, Windows 7 just became the most widely used desktop OS in the world.
This has been a long time coming. Windows XP has been at the top for eons (it launched 10 years ago, and once established, didn’t let go). Windows Vista never managed to threaten XP, so it wasn’t until Windows 7 came around that a shift really started to happen.
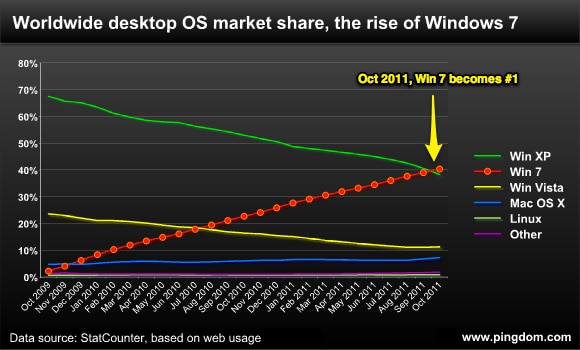
And that shift has happened fast. Windows 7 launched in October of 2009, then…
- Within three months, it overtook Mac OS X.
- Within 10 months, it overtook Windows Vista.
- Now, two years after its launch, it’s finally overtaken Windows XP.
This is probably some kind of record.

The chart above covers the entire life span of Windows 7 so far, counted from its official release date. According to Microsoft, they have already sold over 450 million Windows 7 licenses.
Windows XP is still a strong presence, but at least things are very much pointing in the right direction for Microsoft. They must be relieved. Microsoft surely didn’t expect XP to remain so dominant for so long. As for Windows Vista, it looks like it will die out before XP does in spite of being the newer OS.
You’ll see a close correlation between the combined decline of Vista and XP and the rise of Windows 7, which is to be expected. We’ve shown before that Windows 7 users upgrade from Windows XP and Vista, not from other operating systems. Windows eats Windows, OS cannibalism, so to speak. It’s mostly a natural consequence of Windows having such a dominant market presence.
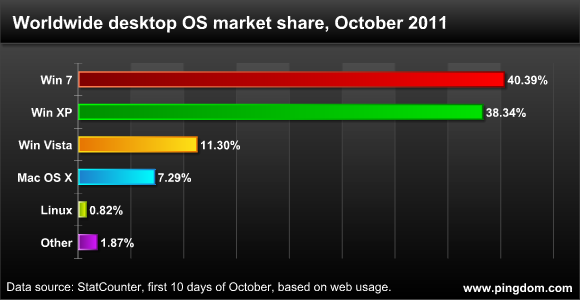
Since the trend chart above isn’t ideal for showing the current situation in detail, here is a snapshot of the desktop operating system market share division as of October 2011, based on the first 10 days of the month:

It should be noted that these numbers are based on web usage (visitor stats to 3+ million sites), so it they won’t map exactly to the physical installed base. But these days, how common is it for PCs not to use the Web and the Internet? It’s also worth pointing out that it’s really the only “in use” metric to be had.
A funny little side note to end with: Over a year ago, we actually predicted that Windows 7 would overtake XP in November 2011. Ok, we were off by a month. So sue us… 😉


