Synthetic Monitoring

Simulate visitor interaction with your site to monitor the end user experience.

View Product Info

FEATURES

Simulate visitor interaction

Identify bottlenecks and speed up your website.

Learn More

Real User Monitoring

Enhance your site performance with data from actual site visitors

View Product Info

FEATURES

Real user insights in real time

Know how your site or web app is performing with real user insights

Learn More

Infrastructure Monitoring Powered by SolarWinds AppOptics

Instant visibility into servers, virtual hosts, and containerized environments

View Infrastructure Monitoring Info
Comprehensive set of turnkey infrastructure integrations

Including dozens of AWS and Azure services, container orchestrations like Docker and Kubernetes, and more 

Learn More

Application Performance Monitoring Powered by SolarWinds AppOptics

Comprehensive, full-stack visibility, and troubleshooting

View Application Performance Monitoring Info
Complete visibility into application issues

Pinpoint the root cause down to a poor-performing line of code

Learn More

Log Management and Analytics Powered by SolarWinds Loggly

Integrated, cost-effective, hosted, and scalable full-stack, multi-source log management

 View Log Management and Analytics Info
Collect, search, and analyze log data

Quickly jump into the relevant logs to accelerate troubleshooting

Learn More

Website Speed Testing

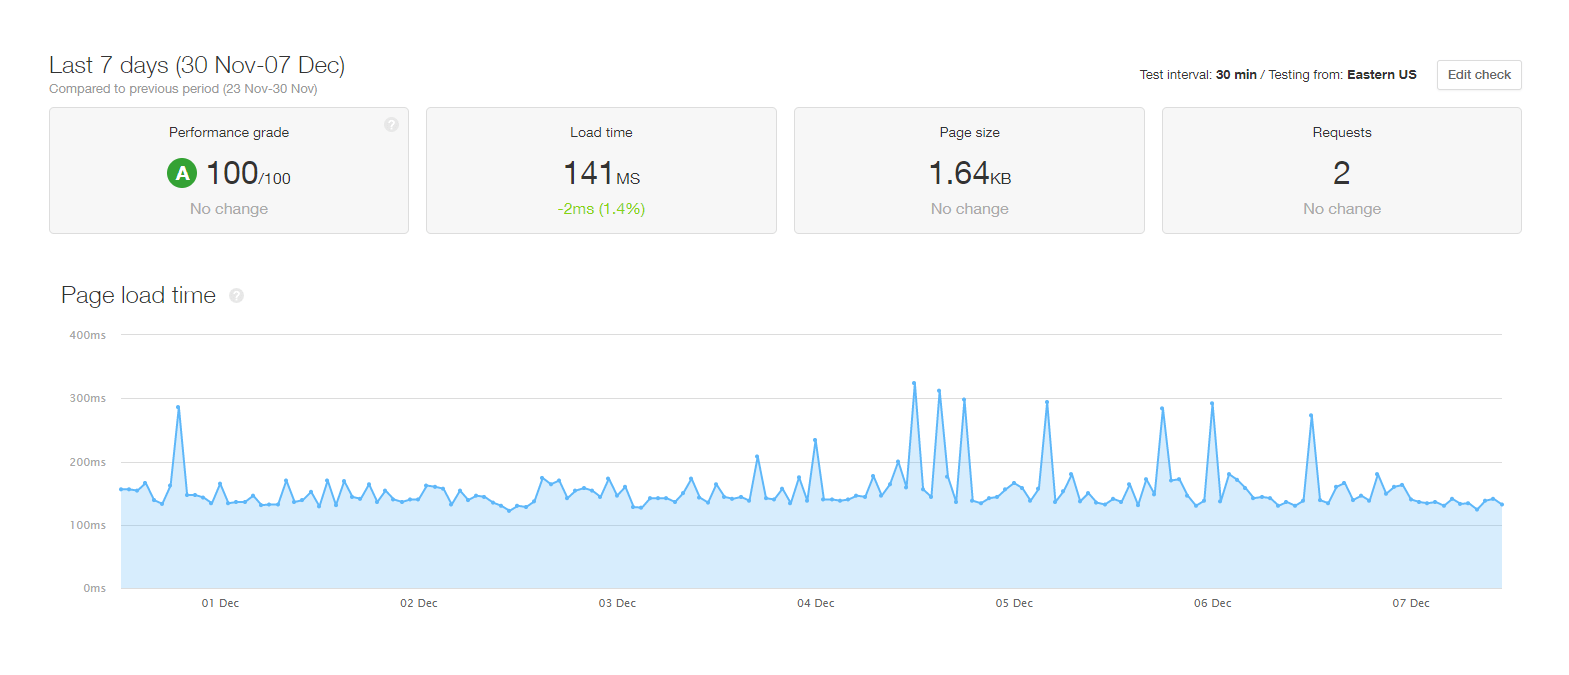
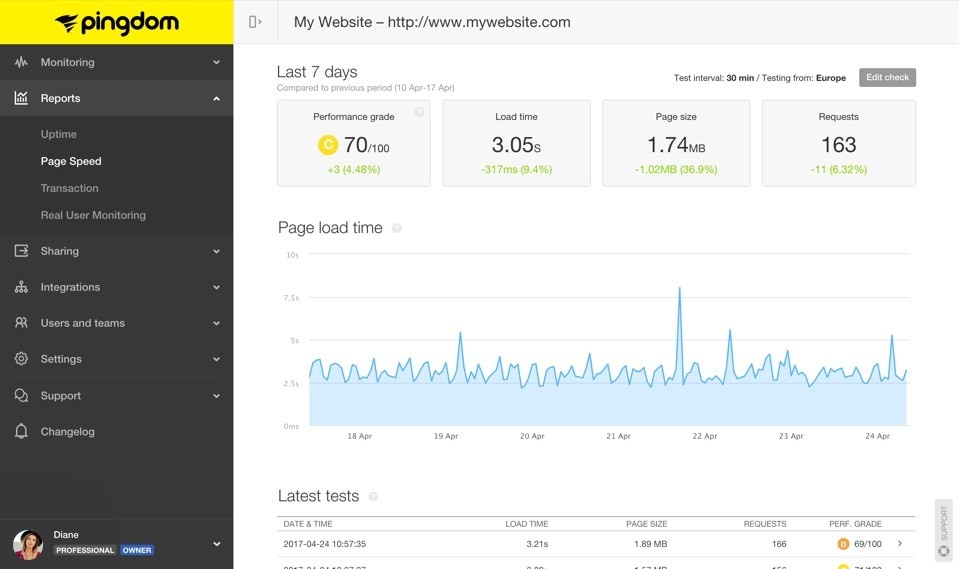
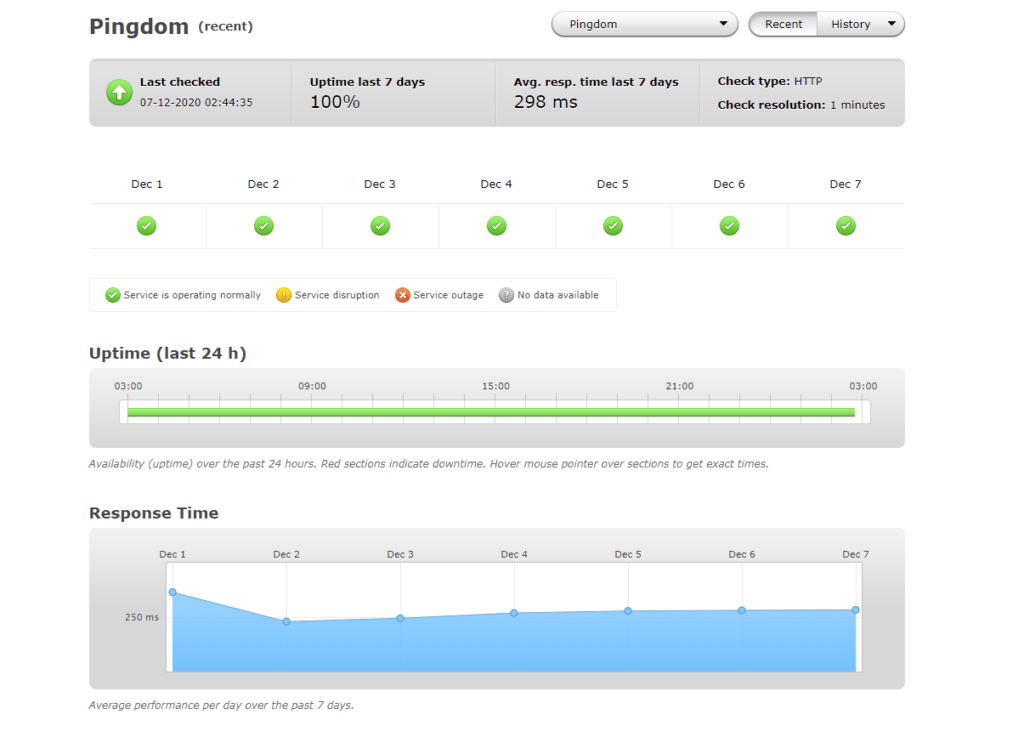
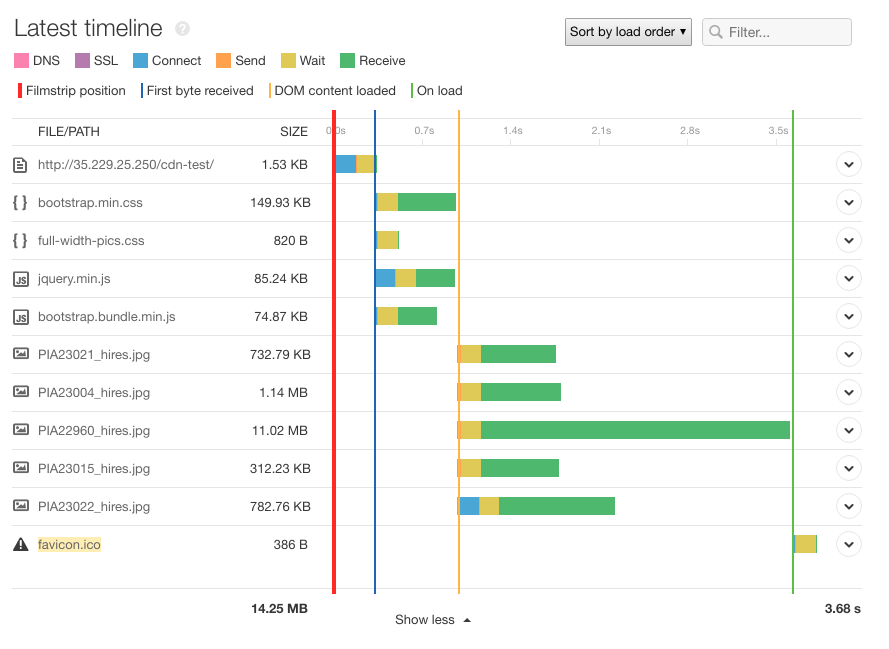
How quickly your webpages load has a significant impact on the end user’s experience and buying decision, which is why effective website speed testing and analysis is so important. With SolarWinds® Pingdom®, you can test and monitor load times and analyze issues causing delays.

Page speed dashboard

How Fast Is Your Website?

Slow is the new down, and if your webpage isn’t loading quickly, it might as well not load at all. A poor-performing website can drive potential customers away, so you need to help ensure your pages are fully optimized for the fastest possible load times. Usually there are multiple issues in play, and Pingdom allows you to see them all.


Pingdom uses a global network of testing centers to check website speed in more than 100 territories. You can now accurately analyze the user experience from anywhere in the world and highlight localized issues in need of additional investigation.

Public status page

Going Beyond Speed

Page load time is an important metric, but there’s more to website performance monitoring. Server response times, time to start render, time to interact, and more provide insight into website load and response times and opportunities for optimization. Pingdom allows you to record and analyze all these metrics and much more.


Effective website speed optimization means tuning every element for maximum performance. Pingdom tests every element to identify bottlenecks, from image downloads to back-end SQL query execution times. Aggregated performance grades summarize the results of every test performed and provide an action plan for improvement.

Page load timeline

Everything You Need for Website Optimization

More than simply website speed testing, Pingdom also accelerates your development team’s responsiveness to performance issues. The more quickly you identify load time issues, the more quickly they can be resolved.

  • Quick and easy deployment – Pingdom simple to set up, so you can begin generating website speed analysis reports for a range of metrics typically in less than one minute. Simply enter your URL and select a testing region. That’s it! Pingdom will proactively test how quickly your page loads every 30 minutes.
  • Page load snapshots – The filmstrip feature captures the elements present on the site every 500ms for the duration it took to load the complete page. With a visual record of the loading process from the user’s perspective, you can begin work to improve load speed by focusing on the pages that contribute to conversions.
Uptime Monitoring

Granular Reporting for Total Visibility

Analyze the performance of every website element in minute detail. Waterfall charts guide you through the page load process, detailing everything you need to streamline your most crucial webpages. Easy-to-understand reports and charts highlight the most important findings, so you can begin corrective work immediately. And because the reports are so easy to understand, you can share your findings with non-technical colleagues too.

Website Speed Testing with Pingdom

Analyze your websites’ load speeds and learn how to make them faster.

Start monitoring for free