Synthetic Monitoring

Simulate visitor interaction with your site to monitor the end user experience.

View Product Info

FEATURES

Simulate visitor interaction

Identify bottlenecks and speed up your website.

Learn More

Real User Monitoring

Enhance your site performance with data from actual site visitors

View Product Info

FEATURES

Real user insights in real time

Know how your site or web app is performing with real user insights

Learn More

Infrastructure Monitoring Powered by SolarWinds AppOptics

Instant visibility into servers, virtual hosts, and containerized environments

View Infrastructure Monitoring Info
Comprehensive set of turnkey infrastructure integrations

Including dozens of AWS and Azure services, container orchestrations like Docker and Kubernetes, and more 

Learn More

Application Performance Monitoring Powered by SolarWinds AppOptics

Comprehensive, full-stack visibility, and troubleshooting

View Application Performance Monitoring Info
Complete visibility into application issues

Pinpoint the root cause down to a poor-performing line of code

Learn More

Log Management and Analytics Powered by SolarWinds Loggly

Integrated, cost-effective, hosted, and scalable full-stack, multi-source log management

 View Log Management and Analytics Info
Collect, search, and analyze log data

Quickly jump into the relevant logs to accelerate troubleshooting

Learn More

End User Experience Monitoring

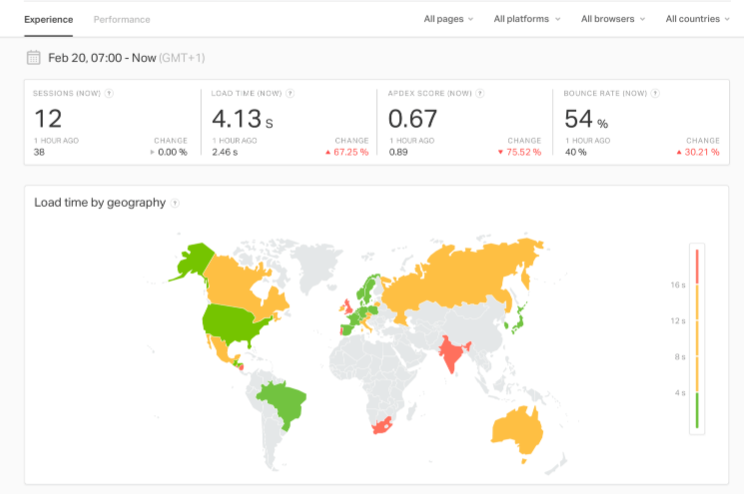
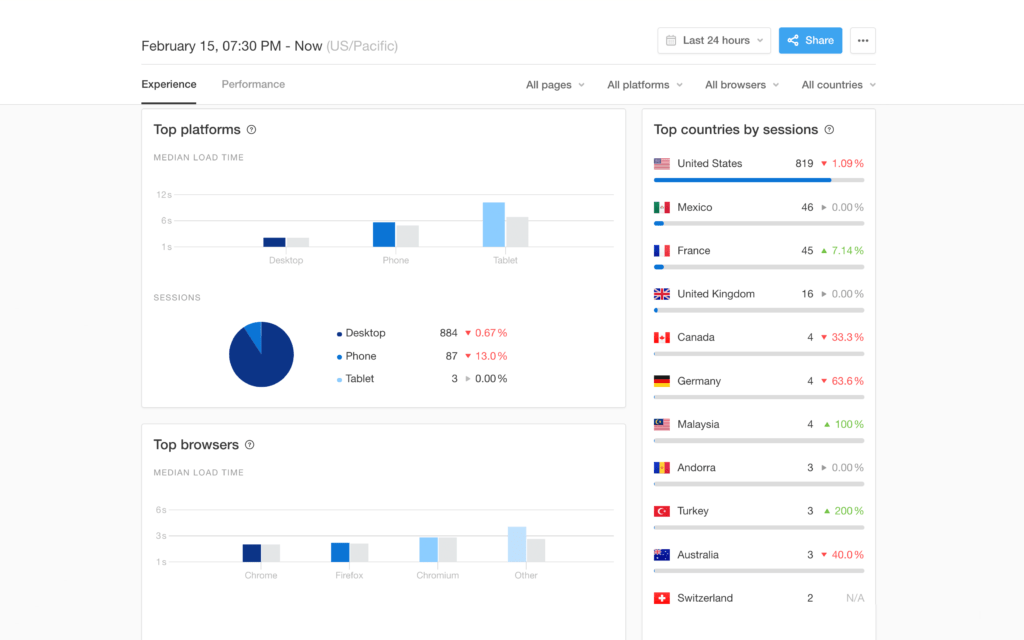
SolarWinds® Pingdom® gives you insight into site performance for users based on their geographic location, browser, and device used.

Pingdom Real User Monitoring Livemap

Enhance web performance for important users

  • Real data in real time – See individual page loads as they happen on your site and view user behavior trends over time to inform site optimization
  • No stone left unturned – Complete webpages, including HTML, CSS, scripts, and images are analyzed, giving you richer performance data and deeper insight into your end-user experience
  • Use advanced filtering options to get performance insight based on users geographic location, device, or web browser

Reports to prove your point

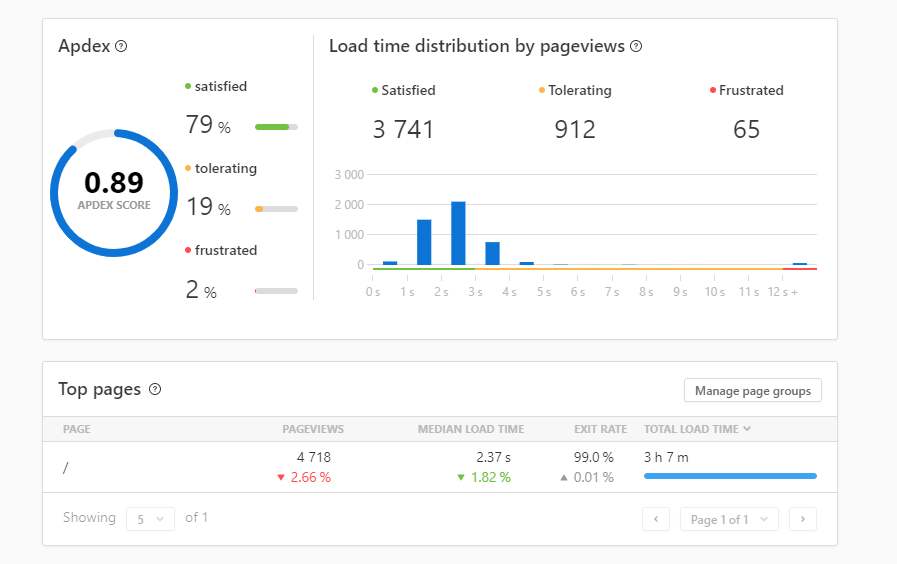
Identify end-user satisfaction levels on a scale of satisfactory, tolerated, and frustrating according to the Apdex score and based on response time. To help you make data-driven decisions on improvements, we’ve equipped all reports with easy to understand visual graphs.

Pingdom real user monitoring reports can be filtered and easily shared with your team or customers.

Page Speed Timeline

Everyone loves a fast website

  • Latest performance trends – View trends to spot any changes in load time that happened over time. For example, if a peak in load time coincided with a peak in the number of visitors, and how it compares to previous load times in the last year.
  • Understand and examine everything – The process of loading a webpage consists of separate steps called loading states. When you click on a link in a web browser to go to a webpage, a complicated process starts. If you’re a webmaster, monitoring this process to see how the performance of your site is affected can be critical to delivering an uninterrupted experience to your end users.

Enhance Web Performance with Pingdom

Pingdom gives you insight into site performance based on the user’s device, browser, or geographic location.


Start monitoring for free